
News
What Is CPI in Forex? Reading an Inflation Release
What is CPI in forex? Learn what the number measures, why the surprise moves the dollar and gold, when it lands in UTC, and how to size a trade around it.
9 min read
Read more →
Set up the Forex Factory calendar for gold: your local time zone, the filters that matter, and why a green USD number often means gold falls.
Here is the catch nobody mentions when they recommend the Forex Factory calendar for gold. Its green and red numbers are colored for the currency, not for gold. A green US jobs number is usually good for the dollar, and that often means pressure on gold.
Once you know that, the calendar becomes one of the most useful free tools a gold trader has. This guide walks through five steps. You set the calendar to your own time zone, filter for the rows that move gold, and read actual against forecast the gold way. Then you build a weekly map and size trades around the red rows.
Forex Factory is a third-party website, and PipsMorrow has no connection to it. Other calendars show the same releases. We use it here because many traders already do, and its layout is a clear way to learn how any economic calendar works.
The calendar is a table of scheduled economic releases and events, one row each. The main columns are the date, time, currency, impact, event name, and three data columns: actual, forecast and previous.
| Column | What it tells you | What it means for gold |
|---|---|---|
| Time | When the release is published, in your chosen time zone | When spreads may widen and price may jump |
| Currency | Which economy the release belongs to | USD rows matter most, because gold is priced in dollars |
| Impact | A colored folder: Forex Factory's own rating of likely volatility | A starting point, not a guarantee |
| Actual | The number as published, filled in at release time | The piece that creates the surprise |
| Forecast | The expected number shown before the release | What the market has roughly priced in |
| Previous | The prior reading, sometimes revised | Context, and a hidden source of surprise |
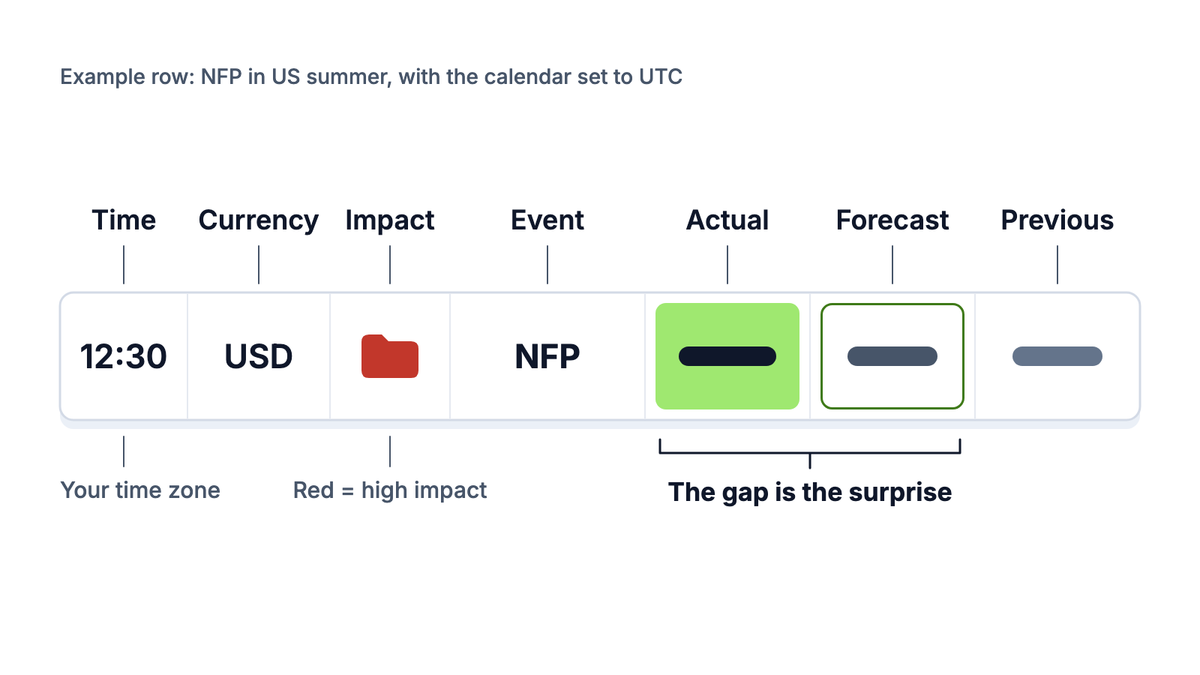
Each row carries a small colored folder. Red means high expected impact, orange medium, and yellow low. The filter also has a separate non-economic category for entries such as bank holidays. These ratings are the site's judgment, and a yellow release can still move gold if it surprises.
Opening an event's details shows background fields. These include the Source (the agency that publishes it), what it Measures, its Frequency, and a Usual Effect line. Forex Factory also launched dedicated event pages with the latest data and a charted history of past readings.
The Usual Effect line matters for gold, and step 3 explains why. For now, the point is that the calendar gives you time, currency, impact and the numbers, and you supply the gold interpretation.
Every other step depends on this one. According to Forex Factory's user guide, you click the clock in the page header to open the time settings. You can choose Match Automatically to use your device's time zone, or pick one from the list.
The guide also says the setting adjusts for daylight saving time automatically, and you can switch between am/pm and 24-hour time. Pick the time zone where you actually trade, not New York or anyone else's. The 24-hour format also helps, because it avoids confusing 1:00 a.m. with 1:00 p.m.
US releases are set in New York time, and the US uses daylight saving time. In 2026, US clocks moved forward on 8 Mar and move back on 1 Nov. So every US release lands one hour earlier in UTC from March to early November.
Your own country may change its clocks on different dates, or not at all. The UK and the EU switched on 29 Mar and switch back on 25 Oct 2026, so for a few weeks a year the gap to New York shrinks by an hour. Places such as Singapore never change, so they see only the US shift.
| US release | New York time (ET) | UTC, US summer (EDT) | UTC, US winter (EST) |
|---|---|---|---|
| Non-Farm Payrolls (NFP) | 8:30 a.m. | 12:30 | 13:30 |
| CPI (consumer prices) | 8:30 a.m. | 12:30 | 13:30 |
| Weekly jobless claims | 8:30 a.m. | 12:30 | 13:30 |
| FOMC statement | 2:00 p.m. | 18:00 | 19:00 |
| FOMC press conference | 2:30 p.m. | 18:30 | 19:30 |
The same 8:30 a.m. NFP release shows how much the local hour varies. In summer it lands at 13:30 in London and 20:30 in Singapore. In Sydney it lands at 22:30 in the southern winter, then 23:30 once Australian daylight saving starts, and 00:30 on Saturday after the US clock change.
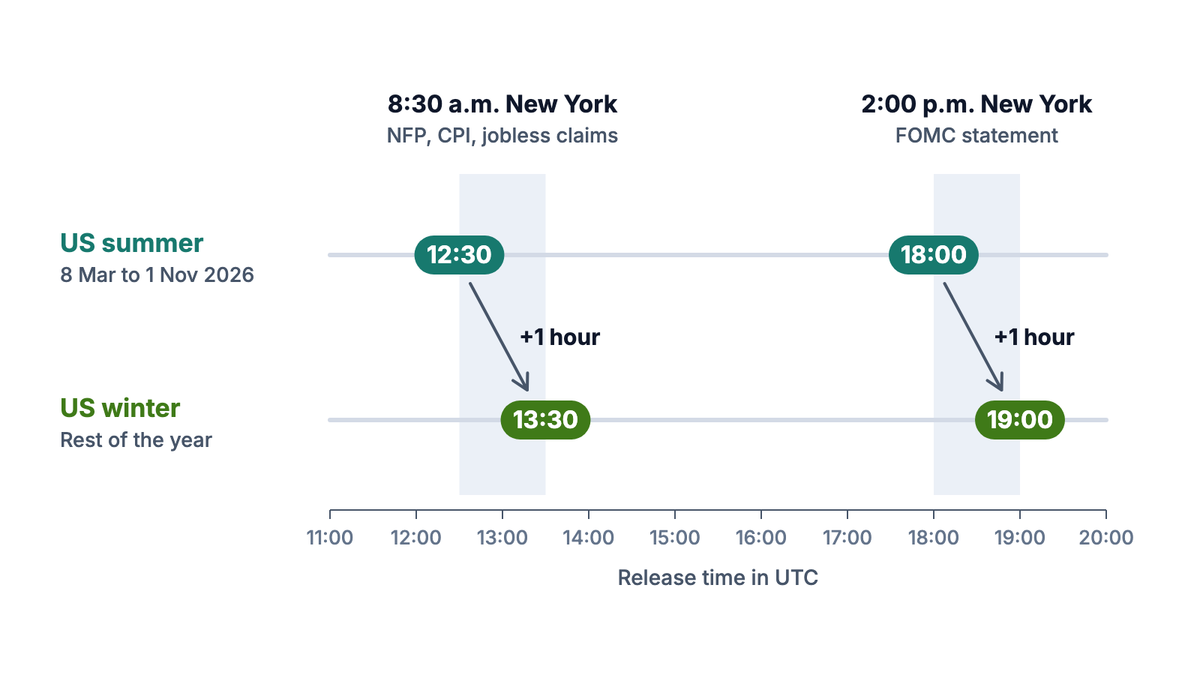
The calendar handles this shift for you once your time zone is set. Check the time shown in the header against a clock you trust, and the rest of the calendar will be right.
An unfiltered week holds dozens of rows across many currencies. The filter panel lets you choose by expected impact, event type and currency, and then apply the selection. Forex Factory's list of impact filters includes high, medium and low impact expected, plus non-economic.
For gold, a practical starting filter looks like this:
The course lesson on Economic Events That Move Gold ranks the US releases by how much they tend to matter. Start with that list, then let the filter do the sorting. A good filter shows you ten or fifteen rows a week, not a hundred.
The lesson on trading around the economic calendar explains consensus, actual and prior in general. The key idea is that the market moves on the difference between actual and forecast, not on whether the number is high or low.
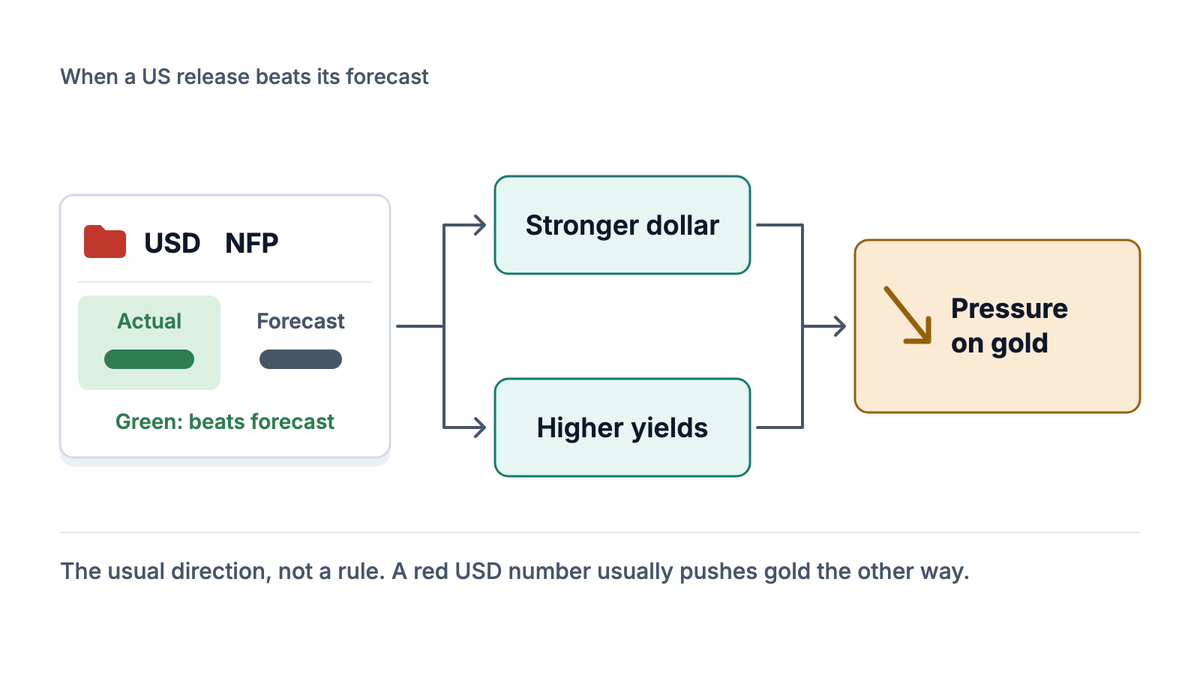
Forex Factory colors the actual number to show that difference. Green means better than forecast, and red means worse. Those colors describe the effect on the currency in that row, which for gold is almost always the dollar.
Better-than-expected US data usually supports the dollar and higher yields, and both tend to weigh on gold. Research backs up the direction. A 2012 study in the Journal of Banking and Finance by Elder, Miao and Ramchander used intraday gold futures data from 2002 to 2008.
The authors found that news of an unexpected improvement in the US economy tended to push gold and silver prices down. They also found the reaction was swift, and that the 8:30 a.m. releases, especially non-farm payrolls, had the largest impact.
| What the calendar shows | Usual reading for USD | Usual pressure on gold |
|---|---|---|
| NFP actual green (above forecast) | Stronger labor market | Downward |
| NFP actual red (below forecast) | Weaker labor market | Upward |
| CPI actual green (hotter inflation) | Higher rates for longer | Downward |
| CPI actual red (cooler inflation) | Earlier or deeper cuts | Upward |
| Previous revised sharply lower | Weaker than thought | Upward, even if the actual looks fine |
Read the whole release
NFP arrives with the unemployment rate, wages and revisions in the same release. The calendar shows each as its own row, and they can disagree. The lesson on employment data and NFP explains which parts traders weigh most.
So the reading rule for gold is: find the surprise, work out what it does to the dollar and yields, then flip it for gold, knowing it won't always hold.
With the filter set, switch to the week view on Sunday evening. Spend ten minutes turning the rows into a plan. The goal is to know, before Monday, which hours you will avoid opening new trades.
That morning re-check matters more than it sounds. During the US government shutdown in late 2025, the Bureau of Labor Statistics moved the September jobs report from 3 Oct to 20 Nov 2025. Dates can change, and a map built on Sunday can be wrong by Wednesday.
The result of this step is a short list. You should be able to say, for each day, the local times when you won't open a new gold trade.
Knowing the time of a release only helps if it changes what you do. The biggest change is position size, because stops behave differently around high-impact news.
Gold trades as XAU/USD, usually as a CFD (a contract that tracks the price without delivering metal). One standard lot is 100 troy ounces, with 1 troy ounce equal to 31.1035 g. On this site's convention, one pip is $0.01, so one pip on one lot is $1.00.
Take a $2,400 account risking 1%, which is $24. With a normal 400-pip ($4.00) stop, the lot size calculator gives 0.06 lot. Now say you hold through NFP with a stop that survives the first spike, such as 2,400 pips ($24.00). The answer drops to 0.01 lot, the smallest size most platforms allow.
| Situation | Stop | Lot size | Money at risk |
|---|---|---|---|
| Normal session | 400 pips ($4.00) | 0.06 | $24 |
| Wider stop for a medium-impact release | 800 pips ($8.00) | 0.03 | $24 |
| Holding through a red USD release | 2,400 pips ($24.00) | 0.01 | $24 |
Try it now
Before a red row, enter the stop you would really need and see what size is left. If it rounds below 0.01 lot, the trade doesn't fit the account at that risk.
Stops are not guaranteed
Around big releases the spread, the gap between buy and sell prices, can widen sharply, and stops can fill well beyond their level. The lesson on execution and slippage explains why. Trading leveraged CFDs can lose you more than you planned.
The rule to carry away: a red row on the calendar is a reason to recalculate size, not just a time to watch.
The calendar is a schedule and a scoreboard. It is not a forecast, and it misses some of what moves gold.
For the official schedule of a specific release, the agencies publish their own: the Federal Reserve for FOMC dates and the Bureau of Labor Statistics for NFP and CPI. If you want to go deeper on FOMC decisions, read FOMC and gold. Use the calendar to know when, and use your own plan to decide what.
Choose your own local time zone, or let the site match your device automatically. Forex Factory then converts US and European release times for you, including the one-hour shifts when those regions change their clocks.
The calendar is organized by the currency each release belongs to. For gold, you mainly track USD rows, because gold is priced in dollars and reacts to US data and Fed policy.
They show Forex Factory's rating of expected impact: red for high, orange for medium and yellow for low. They are a useful first filter, but a low-rated release can still move gold if the surprise is large.
Green means the number was better than forecast for the US dollar. Stronger US data tends to lift the dollar and yields, and that often weighs on gold. The colors describe the currency, so for gold you usually read them in reverse.
The PipsMorrow Team
A team of writers covering XAU/USD gold trading education. We focus on explaining the mechanics and risk management in a structured way, with no trade signals and no promotion of any specific broker.
Last updated
What is CPI in forex? Learn what the number measures, why the surprise moves the dollar and gold, when it lands in UTC, and how to size a trade around it.
9 min read
Read more →Forex session times for Sydney, Tokyo, London and New York in New York time and UTC, with the daylight-saving shifts and the hours that actually move.
10 min read
Read more →FOMC and gold explained: why the rate decision is rarely the news, when it lands in New York time and UTC, and how to size a gold trade around it.
12 min read
Read more →Build on this article with the full gold trading curriculum, ordered from the basics to advanced topics, free.

