
Tools
Forex Factory Calendar for Gold: A 5-Step Setup Guide
Set up the Forex Factory calendar for gold: your local time zone, the filters that matter, and why a green USD number often means gold falls.
11 min read
Read more →
What is CPI in forex? Learn what the number measures, why the surprise moves the dollar and gold, when it lands in UTC, and how to size a trade around it.
If you have ever watched a chart jump at 8:30 a.m. New York time and wondered why, there is a fair chance the answer was CPI. So, what is CPI in forex? It is a monthly inflation report, and it is one of the few scheduled events that can move currencies and gold within seconds.
CPI stands for Consumer Price Index. It tracks how much the price of a fixed basket of everyday goods and services has changed. Traders do not care about the number alone. They care about how it compares with what the market expected, because that gap shifts bets on interest rates.
This guide explains the CPI meaning in forex in plain terms, shows how the reaction chain works, and ends with a risk plan and calculator numbers for release day. It is education, not a trade signal.
The Consumer Price Index follows the cost of a basket that includes housing, food, fuel, transport, medical care and clothing. In the US, the Bureau of Labor Statistics (BLS) publishes it every month. Other major economies publish their own versions, such as the UK, Japan and the euro area.
Two readings come out together. Headline CPI covers the whole basket. Core CPI removes food and energy, because those prices swing with weather, harvests and oil. Core is a cleaner read on underlying price pressure, so it often gets the stronger reaction.
You will also see two ways of quoting the change. Month-on-month (m/m) compares with the prior month. Year-on-year (y/y) compares with the same month a year earlier. A forecast and a result can each be quoted both ways, so check which one a headline is using.
| Reading | What it includes | Why traders care |
|---|---|---|
| Headline CPI | All items in the basket | What households feel; moves with oil and food |
| Core CPI | Everything except food and energy | Underlying trend; often the bigger market mover |
| m/m change | Change from last month | Shows momentum; most sensitive to surprises |
| y/y change | Change from a year ago | Compared against the central bank's target |
The lesson on Inflation Data: CPI and PCE goes deeper on how headline, core and the Fed's preferred PCE gauge differ.
Central banks such as the Federal Reserve aim for stable prices, often an inflation rate near 2%. When inflation runs hot, they may raise interest rates or keep them high. When it cools, they gain room to cut. So CPI is a clue about the future path of rates.
Rates matter for currencies because money tends to follow yield. Higher expected rates on dollar assets can pull in buyers and lift the dollar. Lower expected rates can do the opposite. The article on the carry trade shows the same logic from the borrowing side.
By release time, the market has already priced a forecast. Analysts publish a consensus, such as core CPI +0.3% m/m. If the result matches it, there is little new information and the move is often small. If the result is 0.4% or 0.2%, the market must reprice.
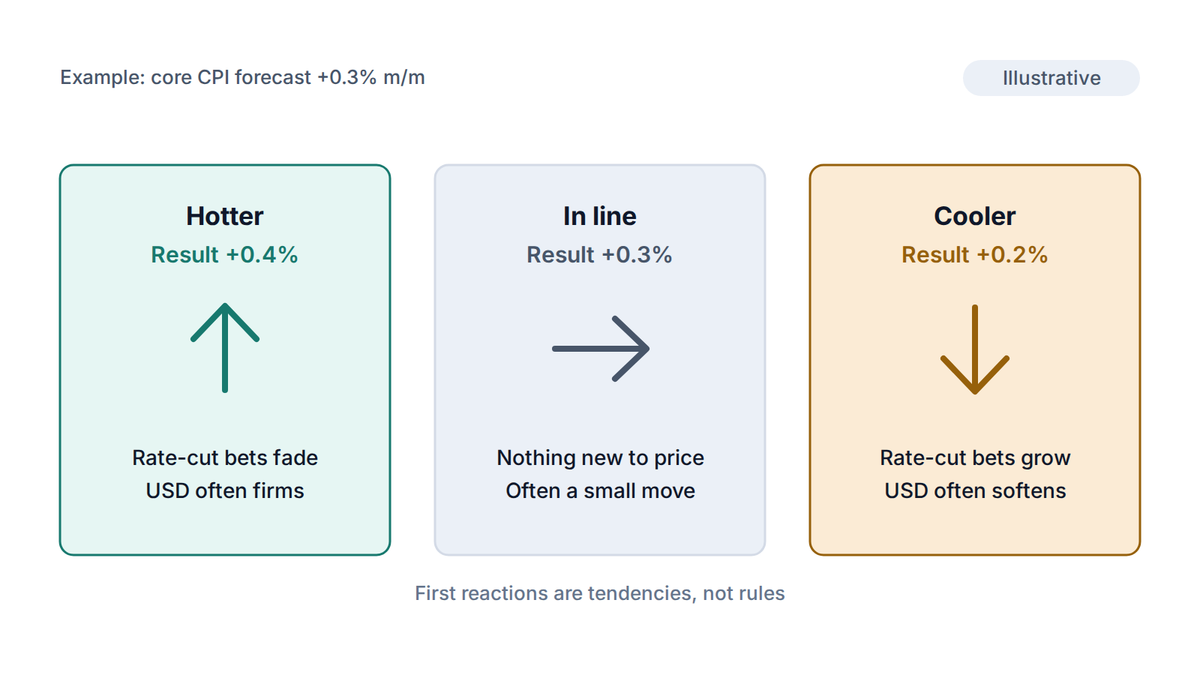
Look at the example in the figure. The forecast is a hypothetical +0.3%, and the three outcomes show how the surprise, not the level, shapes the first reaction. A high CPI that was fully expected can leave the dollar flat, while a small miss can move it a lot.
Gold pays no interest. When real yields rise, holding gold costs more in forgone income, which tends to weigh on its price. A hot CPI that lifts rate expectations and the dollar often pushes XAU/USD (gold priced in US dollars) lower. A cool CPI often does the reverse.
The picture is messier than that. Gold is also a hedge against inflation, so a high reading can draw buyers who worry about prices. The two forces pull in opposite directions, and which one wins on the day depends on how the market reads the Fed. Our article on gold and interest rates covers that tension.
For the same reason, the dollar index and gold often move together in mirror image around CPI. See the DXY and gold correlation for how reliable that link has been.
Research, in brief
Studies of intraday gold futures, including Elder, Miao and Ramchander (2012), found that metals respond quickly to US data surprises, and that stronger-than-expected US news tended to push gold down. That is a tendency across many releases, not a forecast for the next one.
US CPI is released at 8:30 a.m. New York time (ET). The offset to UTC depends on US daylight saving time. During daylight saving, 8:30 a.m. ET is 12:30 UTC. When the US is on standard time, it is 13:30 UTC.
US daylight saving ended on 1 Nov 2026, so the next two releases on the BLS schedule fall on standard time. October 2026 data is due on 10 Nov 2026, and November 2026 data on 10 Dec 2026. Both are at 8:30 a.m. ET, which is 13:30 UTC. Always confirm the date on the official BLS calendar, because schedules can move.
| Release | New York time (ET) | UTC |
|---|---|---|
| October 2026 CPI, 10 Nov 2026 | 8:30 a.m. EST | 13:30 |
| November 2026 CPI, 10 Dec 2026 | 8:30 a.m. EST | 13:30 |
| A release during US daylight saving (March to early November) | 8:30 a.m. EDT | 12:30 |
Your own clock depends on where you live. 13:30 UTC is 13:30 in London in winter, 21:30 in Singapore and 00:30 the next day in Sydney. The Forex Factory calendar guide shows how to convert times and filter for high-impact events.
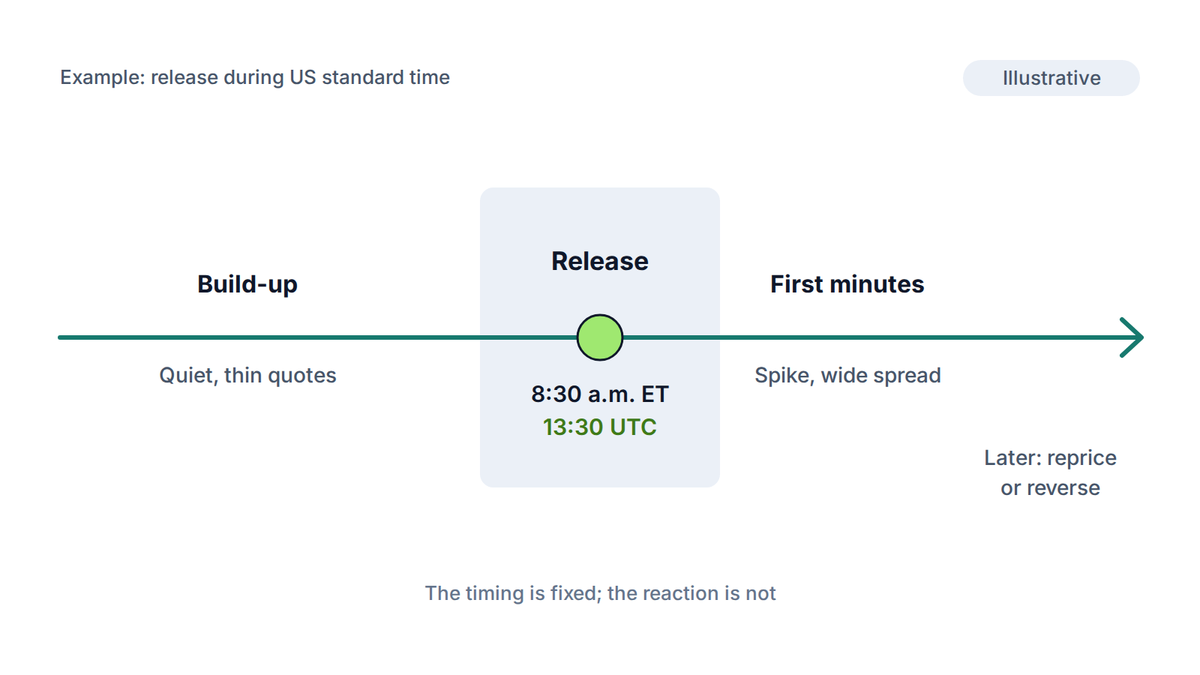
Most traders describe the same sequence. Before the release, liquidity thins and quotes grow cautious. At 8:30 a.m. ET, price jumps. Spreads (the gap between the buy and sell price) widen for a few minutes. Then the market digests the details and may reprice or reverse.
The sister articles on gold before NFP and FOMC and gold describe a similar pattern of liquidity, spread and stop-run behavior. For the spread mechanics, see what is spread in forex.
Take the site's shared example: a $2,400 account risking 1%, or $24 per trade. Say you trade EUR/USD and use a 20-pip stop on a normal day. A pip (percentage in point, the smallest standard price step) is worth $10 per standard lot on EUR/USD.
The lot size calculator gives 0.12 lot for a 20-pip stop. A lot is a standard trade size, and one standard lot is 100,000 units of the base currency. Now suppose CPI is a big surprise and your stop fills 60 pips away. The pip calculator puts the loss at $72, which is 3% of the account.
| Plan | Stop | Lot size | Loss if the stop is hit |
|---|---|---|---|
| Normal-day stop | 20 pips | 0.12 | $24 (1%) |
| Same trade, fill slips to 60 pips | 60 pips | 0.12 | $72 (3%) |
| Sized for a wider news stop | 80 pips | 0.03 | $24 (1%) |
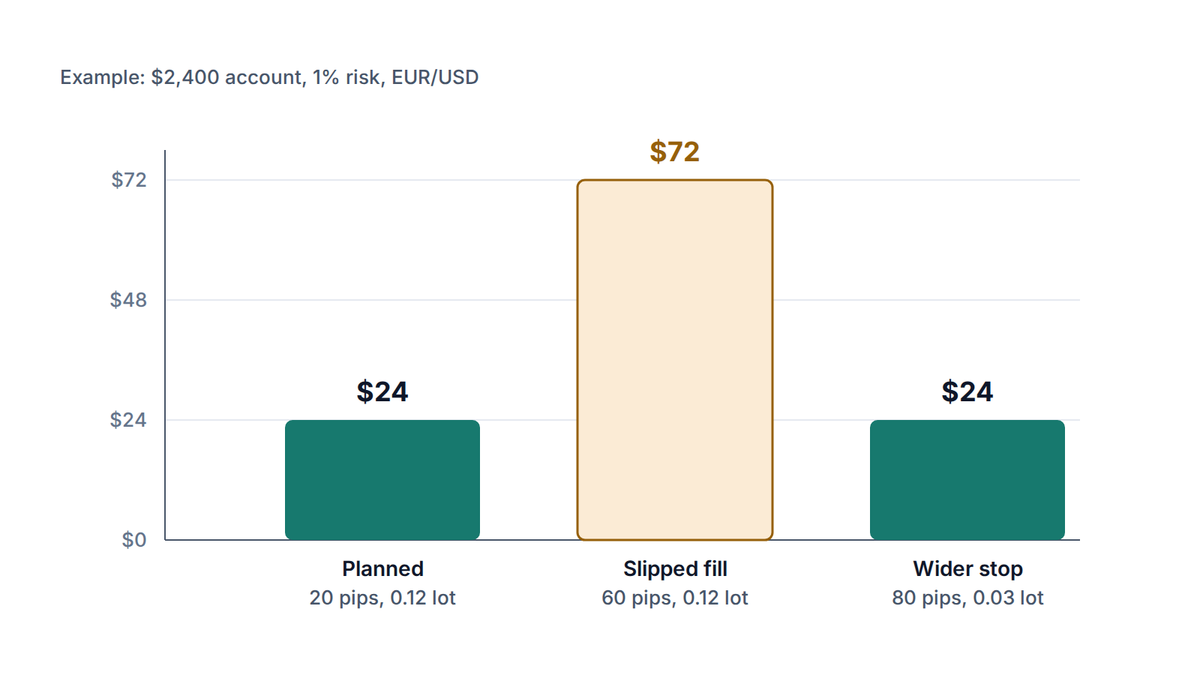
The lot size did not change in the middle row; the fill did. If you hold through CPI, size for the stop you would really need, not the one that suits a quiet chart. The same approach works on gold: 0.06 lot with a 400-pip ($4.00) stop risks $24, but a 2,000-pip slip costs $120.
Try it now
Enter your balance, risk percentage and the wider stop you would need to survive the first minutes after the release. If the result falls below 0.01 lot, the trade does not fit your account at that risk.
None of this predicts direction. It keeps you from being surprised by the mechanics. The lesson on Trading Around the Economic Calendar covers the full routine; here is a short version.
Risk warning
Leverage (controlling a large position with a small deposit) magnifies CPI moves in both directions. A slipped stop can also eat into your margin (the deposit held back for open trades). Trading CFDs and forex can lose you more than you planned.
It is the monthly release of the Consumer Price Index, a measure of how consumer prices have changed. Forex traders follow it because inflation shapes central bank interest rate decisions, which in turn influence currencies.
A higher-than-forecast reading often supports a currency, because it raises the odds of higher interest rates. That is only a tendency. If the market already expected the rise, or reads it as a sign of a weakening economy, the reaction can flip.
US CPI comes out at 8:30 a.m. New York time. That is 12:30 UTC during US daylight saving time and 13:30 UTC on US standard time. The October 2026 data is scheduled for 10 Nov 2026, at 13:30 UTC.
Core CPI often gets more attention, because it strips out volatile food and energy prices and shows the underlying trend. Headline CPI still matters, and the two can point different ways. Watch both against their forecasts.
A hotter reading can lift the dollar and rate expectations, which tends to weigh on gold because it pays no interest. A cooler reading often helps gold. The link is not fixed, since gold is also seen as an inflation hedge.
The PipsMorrow Team
A team of writers covering XAU/USD gold trading education. We focus on explaining the mechanics and risk management in a structured way, with no trade signals and no promotion of any specific broker.
Last updated
Set up the Forex Factory calendar for gold: your local time zone, the filters that matter, and why a green USD number often means gold falls.
11 min read
Read more →Gold as a store of value, honestly: why it kept purchasing power over decades, when it lost real value for years, and what that means on an XAU/USD chart.
9 min read
Read more →Gold price vs interest rates: why the real yield, not the headline rate, drives gold, where that link broke after 2022, and how to size trades around it.
10 min read
Read more →Build on this article with the full gold trading curriculum, ordered from the basics to advanced topics, free.

