
Fundamentals
Gold as a Store of Value: What It Does and Doesn't Promise
Gold as a store of value, honestly: why it kept purchasing power over decades, when it lost real value for years, and what that means on an XAU/USD chart.
9 min read
Read more →
Gold price vs interest rates: why the real yield, not the headline rate, drives gold, where that link broke after 2022, and how to size trades around it.
Most new traders learn one rule about the gold price vs interest rates: when rates go up, gold goes down. It sounds neat, and it is wrong often enough to cost you money. Gold has risen in years when the Fed raised rates, and it has fallen when the Fed cut them.
The rule works better once you swap one word. Gold responds to the real yield, which is the return on a safe bond after you subtract expected inflation. The headline rate is only one input to it, and sometimes the smallest one.
This article shows how the real yield is built, why it matters for an asset that pays nothing, and where the link has stopped working since 2022. It ends with a way to size gold trades around the data that moves yields.
A government bond pays interest. A share can pay dividends. A bar of gold, or a gold CFD (a contract for difference that tracks the price without delivering metal), pays nothing. Holding it has a cost: the income you could have earned elsewhere.
That cost is called opportunity cost. When safe bonds pay little, it is small and gold is easy to hold. When they pay a lot, holding gold means turning down a visible return, and some investors switch.
Gold is also priced in US dollars. Higher US yields often lift the dollar, which makes gold more expensive for buyers in other currencies. So rates can reach gold by two routes at once, as the lesson on what moves the gold price explains.
Notice what this logic really says. It talks about the return on a safe asset after inflation, because inflation is what eats the value of that return. That leads straight to the real yield.
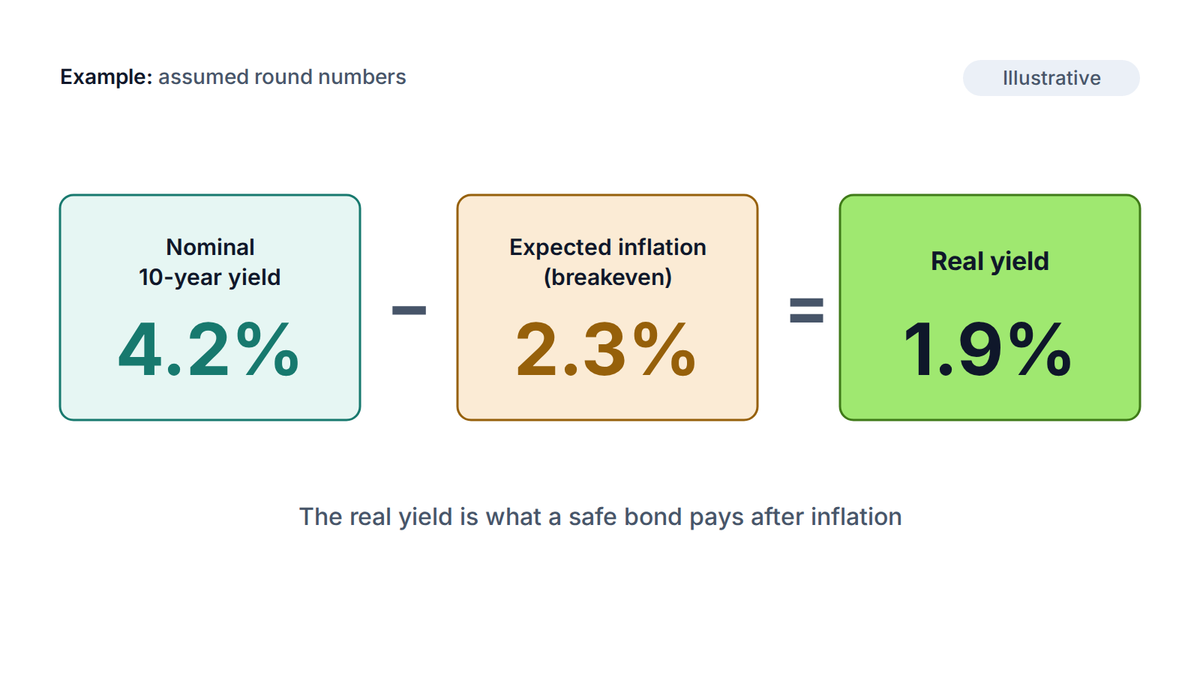
Three numbers get mixed up, so define them first. The policy rate is what the central bank sets for overnight lending. The nominal yield is what a Treasury bond pays, such as the 10-year yield. The real yield is the nominal yield minus the inflation the market expects.
The market publishes that expectation. The US Treasury sells TIPS (Treasury Inflation-Protected Securities), whose principal rises with consumer prices. The gap between a normal 10-year yield and the 10-year TIPS yield is the breakeven inflation rate.
The standard reference series is the Federal Reserve's market yield on 10-year TIPS at constant maturity, listed as DFII10 on the St. Louis Fed's FRED database. It is published daily, so you can check the current level yourself rather than rely on any number printed here.
The numbers in this article are assumed round figures for teaching. They are not today's market levels.
Quick check
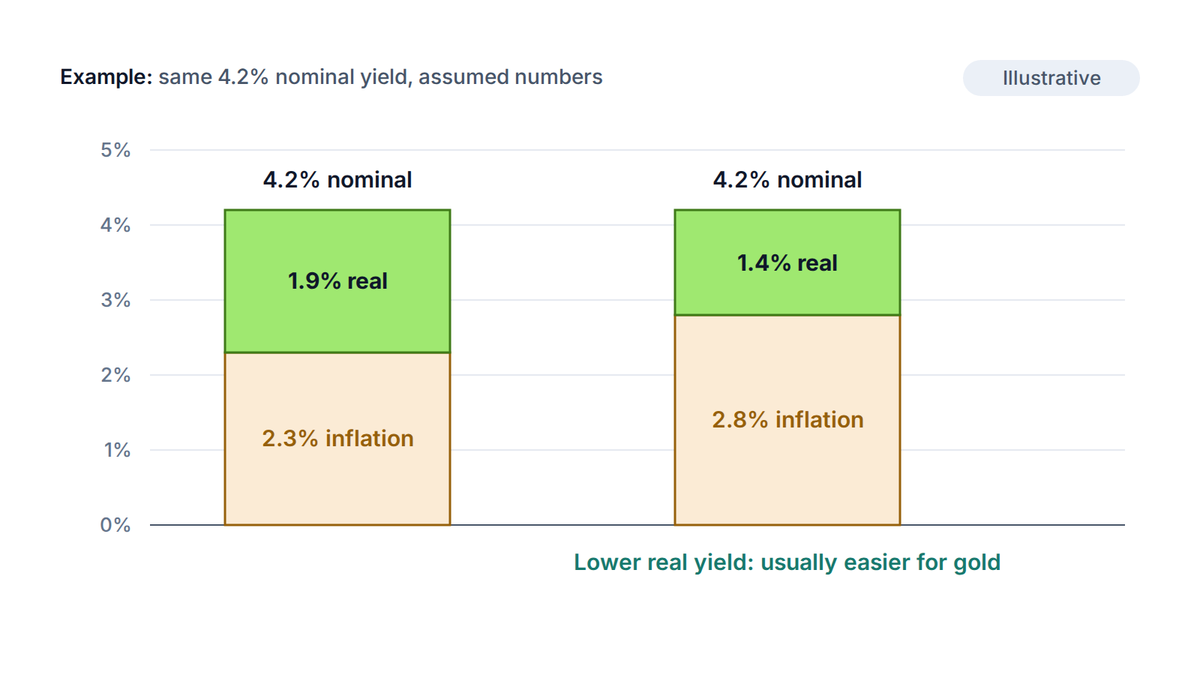
Nominal yield 4.2% minus breakeven 2.3% gives a real yield of 1.9%. If the same nominal yield came with expected inflation of 2.8%, the real yield would be 1.4%.
So the point to keep: the real yield is the part of a bond's return you actually keep, and it is the number gold competes against.
Because the real yield has two parts, the same headline move can push it in opposite directions. What matters is whether the nominal yield moves more or less than inflation expectations.
Here are the common cases, with the textbook direction for gold. They describe the usual channel, not a promise.
| What happens | Nominal yield | Inflation expectation | Real yield | Usual gold direction |
|---|---|---|---|---|
| Fed hikes and the market believes it will beat inflation | Up a lot | Down or flat | Up | Pressure on gold |
| Fed hikes but the market doubts it | Up a little | Up | Flat or down | Gold can hold or rise |
| Fed cuts because growth is weak | Down | Down | Mixed | Unclear; depends on the real yield |
| Inflation surprise to the upside, Fed slow to react | Up a little | Up a lot | Down | Support for gold |
| Growth scare, safe-haven buying of bonds | Down | Flat | Down | Support for gold |
The second row explains why gold can rise in a hiking cycle. If traders think the central bank is behind the curve, expected inflation rises faster than the nominal yield, and the real yield falls even as the headline rate climbs.
The fourth row is why a hot CPI print is not automatically bad for gold. If the market reads it as proof that the Fed will tighten hard, real yields can jump. If it reads it as proof that inflation is running free, they can fall. The lesson on CPI and PCE covers what each report measures.
The takeaway: ask what happened to the real yield, not whether the headline rate went up or down.
For roughly two decades after the late 1990s, gold and the inverted real 10-year yield moved closely together. Asset managers such as Janus Henderson have described the pair as moving almost mechanically up to 2020. When real yields fell, gold tended to rise, and the reverse.
Then the relationship loosened. From 2022, US real yields climbed to levels around 2%, the highest in years, yet gold kept setting new highs. By the old rule, that combination should not last.
The most common explanation is official-sector demand. The same Janus Henderson note, published on 4 Jun 2026, says emerging-market central banks bought roughly 1,000 tons a year from 2022 to 2024, against about 500 tons a year in the previous decade. These buyers care about reserves, not about the return on a bond. The article on institutional gold demand covers why.
One explanation, not the proof
That is one asset manager's reading of the data, and economists argue about how much of the gap it explains. Other factors, such as geopolitical risk and investor flows, also matter. Use it as context, not as a settled fact.
What survives is a shorter-term pattern. Over days and weeks, a sharp rise in real yields still tends to pressure gold, and a sharp fall still tends to help it. What changed is the floor under the price, which is no longer set by yields alone.
For a trader, this means a split view. Use real yields to read near-term direction, and don't assume they cap how far gold can rise.
The information that moves real yields arrives on a schedule: inflation reports, jobs data and Fed meetings. The FOMC and gold article covers the Fed side. Most of these releases come at 8:30 a.m. New York time, which is 12:30 UTC in US summer and 13:30 UTC in US winter.
Gold trades as XAU/USD. One standard lot is 100 troy ounces (31.1035 g each), and one pip (the smallest price step) is $0.01 on this site's convention, so one pip on one lot is worth $1.00. Every $1 move in price is therefore $100 per lot.
Here is a rough feel for the opportunity cost. With gold at $4,300 and a real yield of 1.9%, a safe-bond holder earns about $81.70 a year per ounce above inflation. That is 1.9% of $4,300 and is the return a gold holder gives up. It is a way to picture the trade-off, not a forecast of the price.
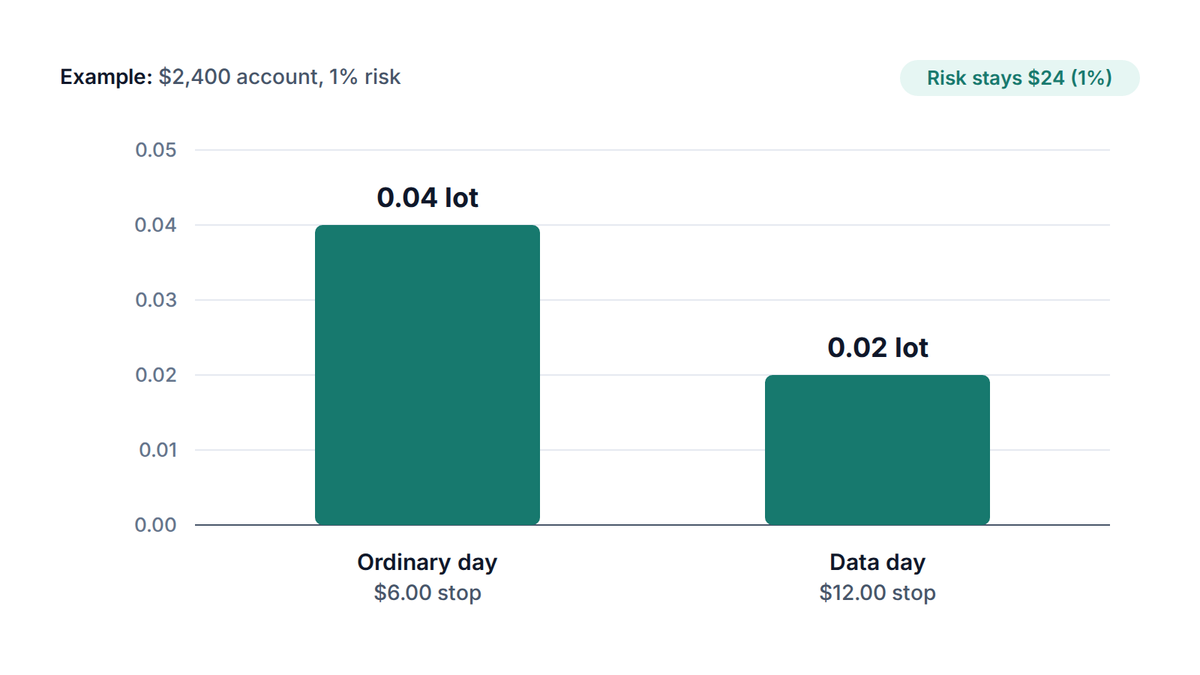
Take a $2,400 account risking 1% per trade, which is $24. On an ordinary day you might use a $6.00 stop. The lot size calculator gives 0.04 lot for a $6.00 stop on XAU/USD.
On a day with a CPI print or Fed speaker, real yields can move several basis points (hundredths of a percentage point) in minutes, and gold swings with them. A stop that survives the noise might need to be $12.00. The same $24 risk then allows only 0.02 lot.
Try it now
Enter your balance, your risk percentage and the stop you need on a data day. If the result is below 0.01 lot, skip the trade or stand aside.
Risk warning
Leverage (using borrowed exposure so a small deposit controls a large position) magnifies gold's moves on yield-driven days, in both directions. Stops can fill beyond your level when price jumps. Trading CFDs can lose you more than you planned, and sometimes your whole deposit.
The rule that follows: size the position for the stop that yield-moving data forces on you, not the tight stop you would like.
You don't need a terminal. A few free pages are enough to keep a real-yield view in your pre-trade routine. The central bank speeches covered in how central banks communicate feed straight into it.
Keep one more caution in mind. Real yields are one driver among several. The dollar, risk sentiment and central bank buying can each overpower them for weeks, so a clean yield signal can still lose.
That is the habit to build: read the real yield as context, then let your own price levels and risk rules make the decision.
Not reliably. Higher rates raise the cost of holding a non-yielding asset, which tends to weigh on gold. But if inflation expectations rise as fast as rates, the real yield doesn't climb and gold can hold up or rise.
It is the return on a safe government bond after subtracting the inflation the market expects. A 4.2% nominal yield with 2.3% expected inflation gives a 1.9% real yield. It shows how much extra purchasing power a bond holder earns.
The 10-year TIPS yield is the usual proxy. The Federal Reserve publishes it daily as series DFII10 on the St. Louis Fed's FRED site, and most charting platforms show it as well. Check that the data is current before relying on it.
Since 2022, gold has stayed strong even with real yields near 2%. Heavy buying by central banks is a widely cited reason, because they hold gold as a reserve rather than for yield. It is an explanation, not a proven cause.
No. Spreads widen and prices can gap around these releases, so risk is harder to control. Many traders reduce size or stand aside, and practice on a demo account first.
The PipsMorrow Team
A team of writers covering XAU/USD gold trading education. We focus on explaining the mechanics and risk management in a structured way, with no trade signals and no promotion of any specific broker.
Last updated
Gold as a store of value, honestly: why it kept purchasing power over decades, when it lost real value for years, and what that means on an XAU/USD chart.
9 min read
Read more →The carry trade explained: how holding a high-rate currency against a low-rate one earns a daily swap, and why the trade unwinds all at once.
12 min read
Read more →What is CPI in forex? Learn what the number measures, why the surprise moves the dollar and gold, when it lands in UTC, and how to size a trade around it.
9 min read
Read more →Build on this article with the full gold trading curriculum, ordered from the basics to advanced topics, free.

