
Fundamentals
Gold and Financial Sanctions: What 2022 Changed for Gold
Gold and financial sanctions after 2022: the Russian reserve freeze, the LBMA refinery ban, why central banks turned to gold, and what it means for XAU/USD.
8 min read
Read more →
Institutional gold demand explained with World Gold Council data: why central banks and funds buy, how much, and what it can and can't tell you on XAU/USD.
Central banks bought more than 1,000 tonnes of gold in each of 2022, 2023 and 2024, according to the World Gold Council. That's about double their 2010 to 2021 average of 473 tonnes a year. Yet on the day those purchases happen, you usually can't see them on an XAU/USD chart at all.
That gap is the key to institutional gold demand. It is large, persistent and slow, and it's reported weeks or months after the fact. This article covers who the big buyers are, why they buy and what the numbers show. It also shows how to use that knowledge without mistaking it for a trade signal.
"Institutional" covers several very different groups. They buy for different reasons and react to price in different ways, so it pays to keep them apart.
| Buyer | Why it holds gold | How you find out | Speed |
|---|---|---|---|
| Central banks | Reserve diversification, crisis protection, no credit risk | IMF data and WGC monthly reports, often weeks later | Slow, steady |
| Sovereign funds | Long-term wealth storage | Occasional disclosures | Slow |
| Gold ETFs | Investors wanting gold exposure through a share | Daily holdings data, WGC monthly flows | Fast |
| Hedge funds and futures traders | Short-term views on rates, dollar, risk | Weekly COT report | Very fast |
An ETF (exchange-traded fund) is a fund that trades like a share and, for gold funds, holds physical metal in a vault. The ways to trade gold lesson covers the big US gold ETFs, and the tools lesson explains how to read the COT (Commitments of Traders) report.
Central banks were net sellers of gold through the 1990s. In 1999, 15 European central banks signed the first Central Bank Gold Agreement. It capped their combined sales at about 400 tonnes a year. The WGC counts 2010 as the start of an unbroken run of net buying that continues today.
| Period | Net central bank purchases | Note |
|---|---|---|
| 2010 to 2021 average | 473 tonnes a year | The pre-2022 baseline |
| 2022, 2023, 2024 | Over 1,000 tonnes each year | 2024 revised to 1,092 tonnes |
| 2025 | 863 tonnes | Down 21%, still far above the baseline |
| Q1 2026 | 57 tonnes | Revised estimate |
| Q2 2026 | 289 tonnes | A record for a second quarter |
Buying is spread across many countries. According to the WGC, the National Bank of Poland was the largest buyer in 2025, at 102 tonnes. Kazakhstan (57 tonnes) and Brazil (43 tonnes) came next. China, Turkey, the Czech Republic and Azerbaijan's state oil fund also added. Singapore and Russia were among the sellers.
Some buyers state a target. Poland's gold reached 28% of its reserves in 2025, close to a 30% goal, and it added another 51 tonnes in Q2 2026. According to the WGC, its holdings reached 550 tonnes at the end of 2025, and Governor Adam Glapiński has said he intends to lift them to 700 tonnes for national security reasons.
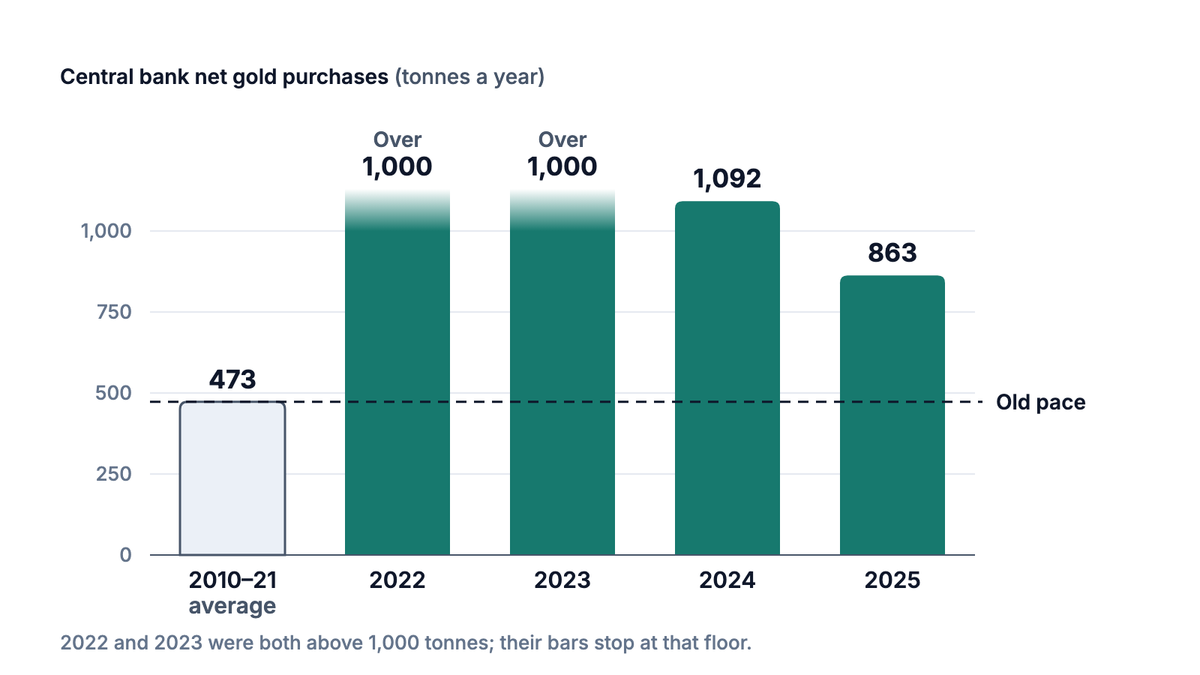
The point: the step change came in 2022, and even the slower 2025 pace was nearly double the old baseline.
The best evidence comes from central banks themselves. The WGC's 2026 Central Bank Gold Reserves Survey drew a record 76 responses. Its main findings:
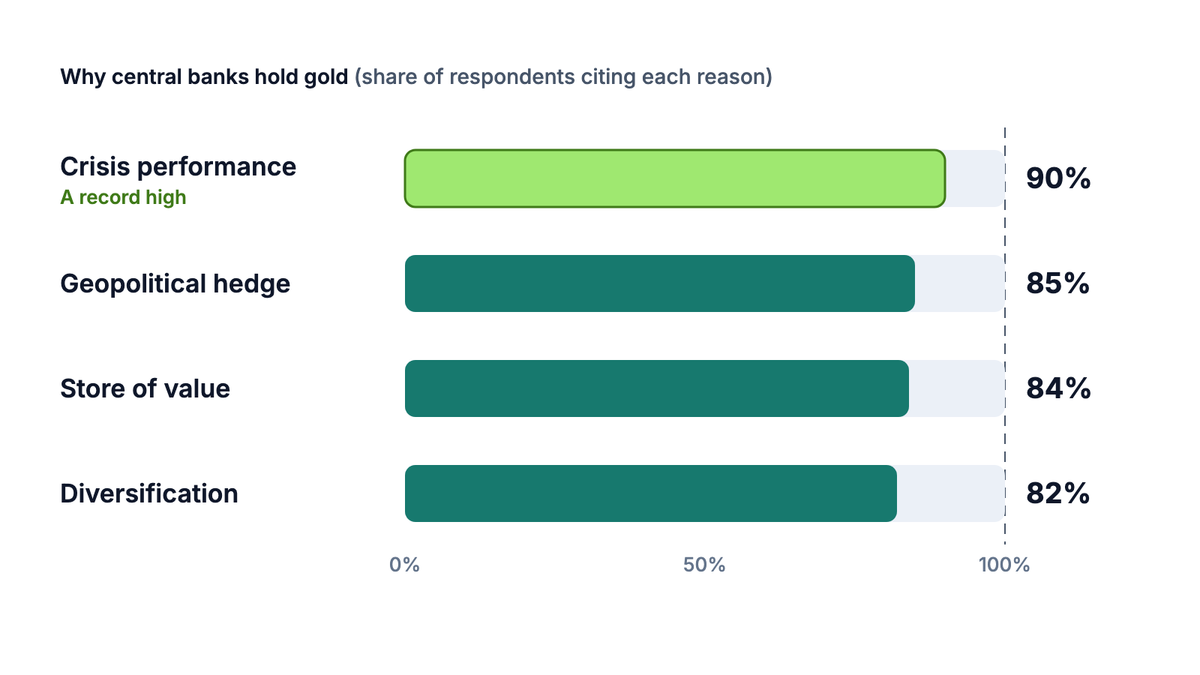
Behind those answers are two features no bond has. Gold has no issuer, so it can't default. And gold held in your own vault sits outside any other country's legal reach. The second point grew far more important after 2022, which the article on gold and financial sanctions covers in detail.
Tonnes versus value
The European Central Bank reported that gold made up 27% of global official reserves at the end of 2025. That put it ahead of the euro (15%) and US Treasuries (22%). The ECB was clear that this mostly reflects the higher gold price, not only new buying. A rising price lifts gold's share automatically.
Central banks are not a one-way bid. The ECB noted that Turkey's central bank sold or lent out about 130 tonnes to defend its currency. The WGC named Russia the largest seller in Q2 2026. When a country needs cash, gold is one of the first things it can sell.
ETF demand behaves very differently. According to the WGC, 2025 was the strongest year on record for gold ETF inflows, at $89 billion. Holdings rose by 801 tonnes to a record 4,025 tonnes, worth $559 billion.
Then the flows turned. In Q2 2026 global gold ETF holdings fell by 45 tonnes. The WGC linked this to a weaker gold price, higher expected interest rates and a stronger dollar. North American funds lost 61 tonnes over the first half, while Asian funds added 70 tonnes.
That's the pattern to remember. Fund investors respond to the same things the what moves gold lesson describes: real yields, the dollar, and rate expectations. Central banks respond much less to those drivers.
2022 showed the split clearly. The WGC reported that real yields on 10-year US inflation-protected bonds rose about 2.5 percentage points and the dollar gained over 8%. Investment demand was weak, yet gold still ended the year up 0.4%, because exceptional central bank buying absorbed the selling.
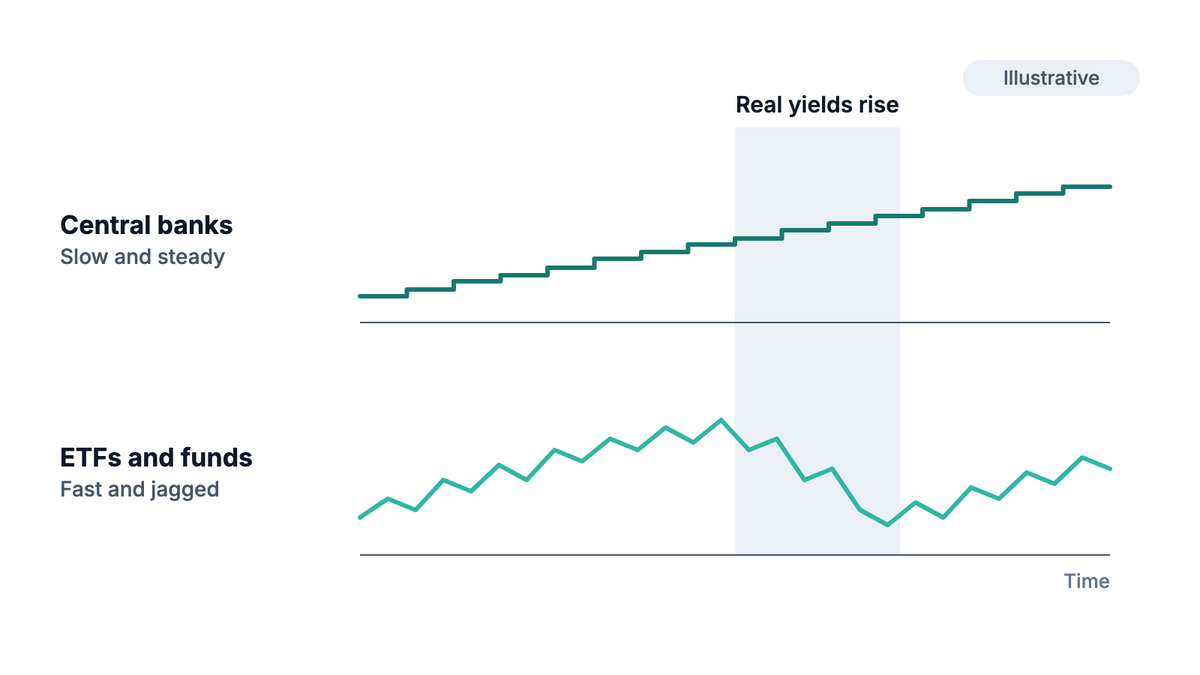
Central bank demand rarely explains a single candle. It works like a slow tide under the waves. Over months it can support price, which is one reason many analysts think gold held up in 2022 and 2023 despite high real yields.
The data also arrive late. The WGC's monthly central bank statistics reflect figures reported through the IMF, so a month's buying typically appears several weeks afterwards. By the time you read "central banks bought heavily in October", that demand is already in the price.
Knowing a large buyer exists doesn't tell you where price will be tomorrow. Gold can fall hard while central banks are buying. On the site's shared example, a $2,400 account holding 0.10 lot (10 troy ounces, the standard 100-ounce contract scaled down) loses $400 on a $40 drop. That's about 17% of the account, whatever central banks do that month.
The fix is the same as for any trade: size from your stop, not from the story. Risking 1% of $2,400 is $24. With a stop $12 away (1,200 pips, where one pip on gold is $0.01), the lot size calculator gives 0.02 lot. The gold risk management lesson walks through the method.
Try it now
Enter your balance, risk percentage and stop distance to get a lot size that caps the loss, however strong the long-term demand story sounds.
Where the data can help
Use institutional flows as context for your bias on higher timeframes, not as an entry trigger. A quarter of heavy central bank buying alongside ETF selling tells you who is on each side. It doesn't tell you when to act.
In the WGC's 2026 survey, central banks most often cited gold's performance in crises and its role as a long-term store of value. Diversification and protection against geopolitical risk followed closely. Gold also has no issuer that can default.
According to the WGC, they bought over 1,000 tonnes in each of 2022, 2023 and 2024, and 863 tonnes in 2025. The 2010 to 2021 average was 473 tonnes a year.
It adds steady demand, which can support price over months and years. It doesn't move price predictably on any given day, and the data are published with a delay.
ETF investors react quickly to interest rates, the dollar and price momentum, so flows swing between buying and selling. Central banks buy on long-term reserve policy and change course far more slowly.
In 2025 it was the National Bank of Poland, for the second year running. According to the World Gold Council, it added 102 tonnes, taking its holdings to 550 tonnes, or 28% of its reserves.
China's reported buying was far smaller that year: net purchases of 27 tonnes, for reported reserves of 2,306 tonnes, according to the same WGC data.
The PipsMorrow Team
A team of writers covering XAU/USD gold trading education. We focus on explaining the mechanics and risk management in a structured way, with no trade signals and no promotion of any specific broker.
Last updated
Gold and financial sanctions after 2022: the Russian reserve freeze, the LBMA refinery ban, why central banks turned to gold, and what it means for XAU/USD.
8 min read
Read more →FOMC and gold explained: why the rate decision is rarely the news, when it lands in New York time and UTC, and how to size a gold trade around it.
12 min read
Read more →The yen carry trade explained: why traders borrow cheap yen to hold higher-yielding assets, how the numbers work, and what happens when it unwinds.
11 min read
Read more →Build on this article with the full gold trading curriculum, ordered from the basics to advanced topics, free.

