
Gold
Gold Price vs Interest Rates: Why Real Yields Matter More
Gold price vs interest rates: why the real yield, not the headline rate, drives gold, where that link broke after 2022, and how to size trades around it.
10 min read
Read more →
Gold as a store of value, honestly: why it kept purchasing power over decades, when it lost real value for years, and what that means on an XAU/USD chart.
On 21 Jan 1980 the London gold price was fixed at $850 an ounce. Anyone who bought that day waited until Jan 2008 to see $850 again. After inflation, they waited far longer, until 2025 by most estimates. Yet gold is still called the classic store of value, and that is not wrong either.
Both statements are true because "store of value" is a promise about decades, not about any year you happen to pick. This article looks honestly at gold as a store of value. It covers what the phrase means and the periods when gold lost real value. It also shows why none of it protects a leveraged position on an XAU/USD chart.
A store of value is something that keeps its purchasing power over long stretches of time. It does not mean the price is stable, and it does not mean the price only rises. Cash in a bank fails the test slowly through inflation. A single company share can fail it suddenly through bankruptcy.
Gold's case rests on a few physical and financial facts rather than on faith. It doesn't rust or decay, so the gold mined centuries ago still exists. Nobody issues it, so it carries no credit risk: there is no borrower who can default on it. And no government can print more of it.
Supply grows slowly. According to World Gold Council figures based on Metals Focus estimates, total above-ground gold was 219,891 tonnes at the end of 2025. Mines produced 3,672 tonnes that year, a record, which still adds well under 2% to the existing stock. Compare that with how fast many currencies' money supply can expand.
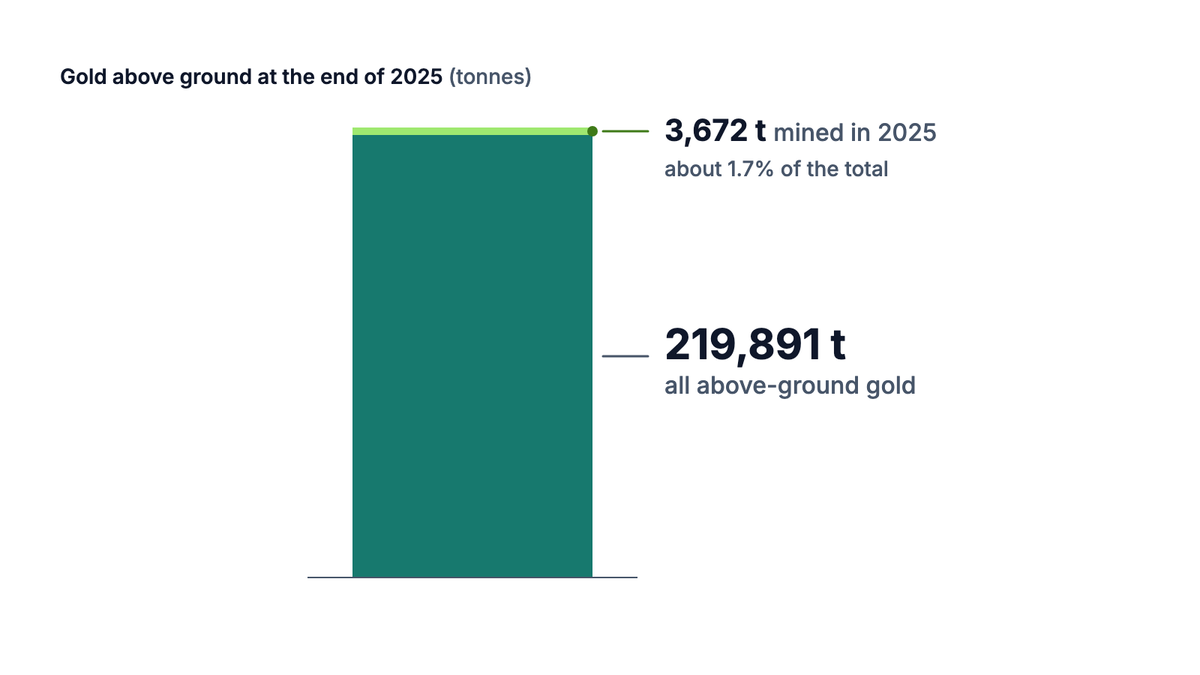
The point: gold is hard to dilute. That scarcity is the foundation of the store-of-value idea, and it's why central banks still hold it as a reserve asset.
Over the full modern era, gold has done its job. The US ended the dollar's link to gold in Aug 1971. The official price then was $35 per troy ounce (31.1035 g, the standard unit for precious metals). According to the World Gold Council, the dollar gold price rose about 9% a year on an annualized basis from 1971 to the end of 2025.
The same WGC analysis notes that gold outpaced both US and world consumer price indices over that period. So measured from 1971, a holder kept and grew purchasing power. The Gold in the Financial System lesson covers the Bretton Woods background if you want the full history.
The catch is the starting point. An annual average over 54 years hides some very long losing stretches, and those matter more to a real person than an average does.
This is the part most "gold always holds its value" articles skip. There were long periods when gold lost purchasing power, some lasting longer than a typical career.
| Period | What happened | Source |
|---|---|---|
| Jan 1980 to 1989 | From the $850 fix to just above $400 by the end of 1989, a fall of about half | LBMA, Alchemist |
| Jan 1980 to Jan 2008 | 28 years before the nominal $850 record was beaten, at $865.35 on 3 Jan 2008 | London fix history |
| Jan 1980 to 2025 | About 45 years before the inflation-adjusted 1980 peak was passed | LBMA (Apr 2025); Bloomberg (Sep 2025) |
| Sep 2011 to Dec 2015 | From about $1,895 to about $1,049, a drop of roughly 45% | London fix history |
| 2022 | Gold rose 0.4% while US CPI inflation reached 9.1% in June | World Gold Council; US BLS |
The inflation-adjusted date is worth a note. The LBMA's Alchemist journal put $850 in 1980 at about $3,325 in 2025 dollars, a level gold passed in Apr 2025. Bloomberg, using a CPI adjustment, reported the crossing in Sep 2025. Either way, the answer is more than four decades.
Gold pays no interest. When real yields rise (bond yields after inflation), holding gold means giving up a positive, safe return elsewhere. That opportunity cost pushed gold down through the 1980s and again from 2013. The interest rates lesson explains nominal versus real rates in depth.
2022 is the clearest modern example. According to the WGC, real yields on 10-year US inflation-protected bonds rose about 2.5 percentage points and the dollar gained over 8%. Gold ended the year roughly flat in dollar terms, even with inflation at a 40-year high. It didn't lose much, but it didn't hedge the inflation either.
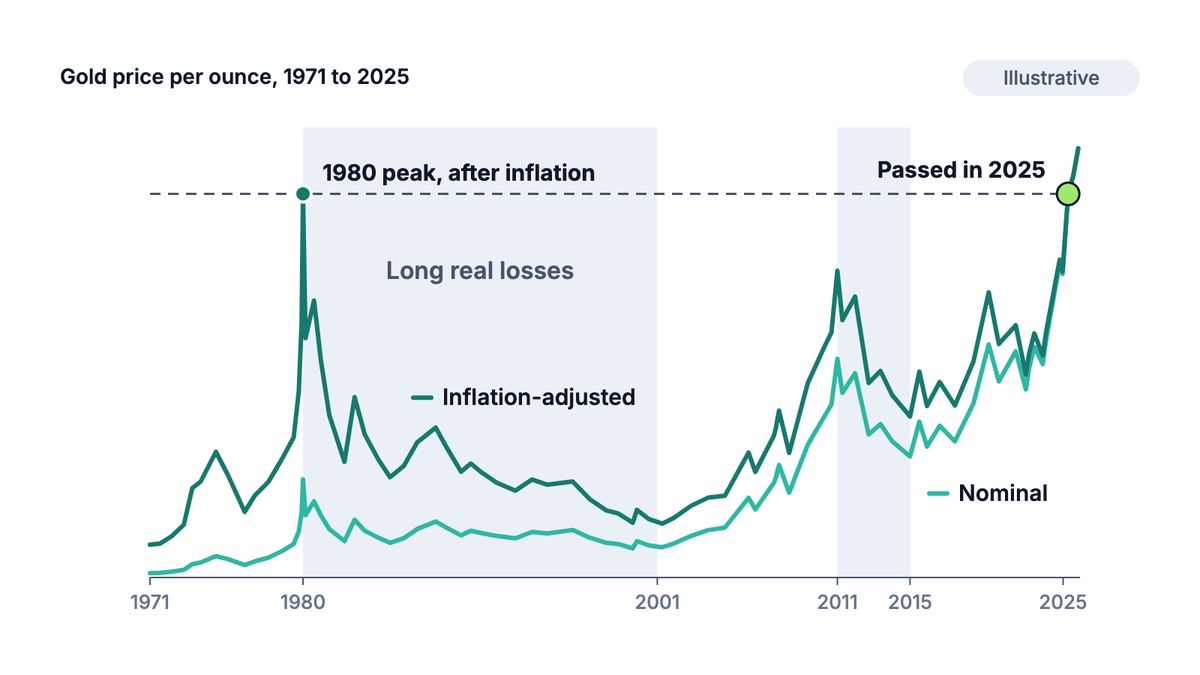
The London fix bottomed at $252.80 on 20 Jul 1999, about 70% below the 1980 peak. A 70% fall needs a 233% rise just to get back to even. You can check that asymmetry with the drawdown calculator. The point: a store of value can still put you underwater for a very long time if you buy at the wrong moment.
XAU/USD measures gold in US dollars. A saver in Europe measures it in euros, and a saver in Japan measures it in yen. The exchange rate between their currency and the dollar can change the answer completely.
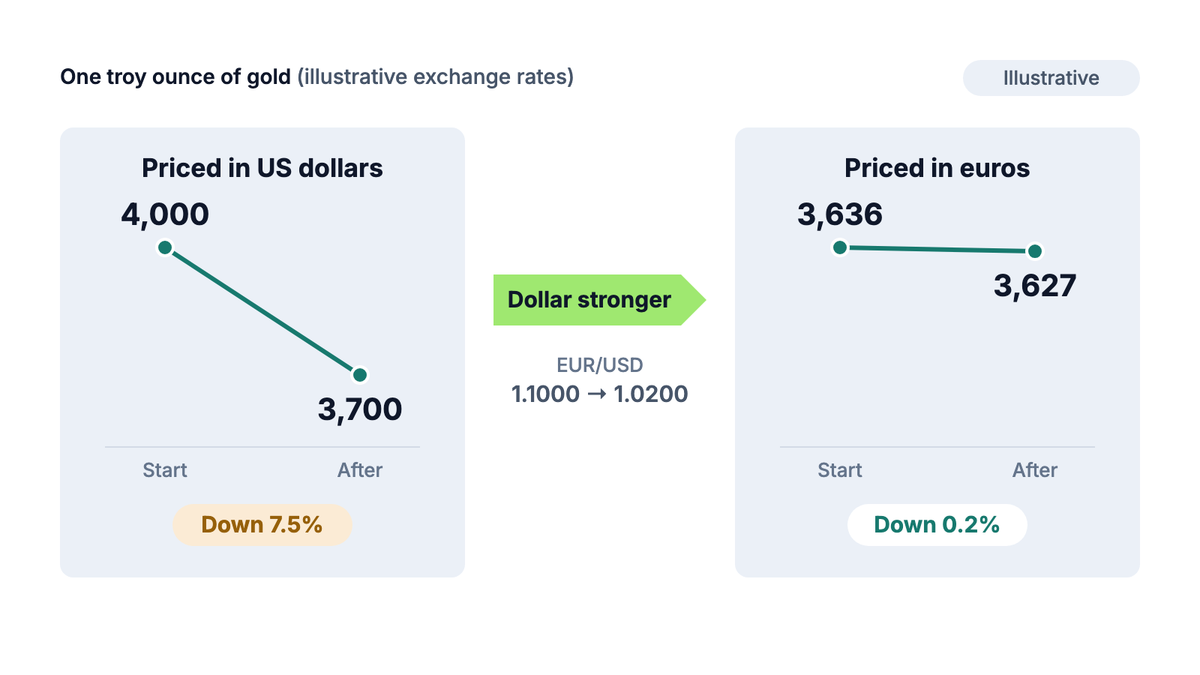
Here is a simple illustration with one troy ounce of gold. The local price is the dollar price converted at the exchange rate: divide by EUR/USD, or multiply by USD/JPY. The rates below are chosen to show the mechanism, not taken from any real date, and they are not a forecast.
| Scenario | Spot gold (USD) | EUR/USD | Gold in EUR | USD/JPY | Gold in JPY |
|---|---|---|---|---|---|
| Start | $4,000 | 1.1000 | 3,636 EUR | 150.00 | 600,000 JPY |
| Gold falls, dollar rises | $3,700 | 1.0200 | 3,627 EUR | 162.00 | 599,400 JPY |
Gold fell 7.5% in dollars, yet the euro and yen prices barely moved because the dollar strengthened against both. The reverse also happens: a rising XAU/USD can be partly cancelled for a foreign saver when their own currency gains on the dollar. When someone says gold "held its value", always ask: measured in what?
The same exchange-rate effect reaches a dollar-denominated trade in the opposite direction. If your account is funded in dollars, your XAU/USD profit or loss is counted in dollars, whatever happens to your home currency. The profit/loss calculator shows that dollar result for any move.
Try it now
Enter a gold entry and exit price and a lot size to see the profit or loss in dollars before you trade.
Store-of-value demand works on a horizon of years. Central banks and long-term savers buy slowly and hold. The article on institutional gold demand shows how that buying shows up in quarterly data rather than on a 15-minute chart.
A trade on XAU/USD usually runs on a horizon of minutes to weeks. Most retail traders use a CFD (contract for difference), a contract that tracks the price without you owning any metal. It's also usually leveraged, meaning you control a large position with a small deposit called margin.
Take the site's shared example: a $2,400 account buying 0.10 lot at $4,000, with 1:500 leverage. A lot on gold is 100 troy ounces, so 0.10 lot is 10 ounces. The margin calculator shows required margin of only $80. The position's full value, though, is $40,000.
If gold drops $100, a routine move in a volatile week, the profit/loss calculator gives a loss of $1,000. That's about 42% of the account. Gold's 50-year record does nothing to soften that. The leverage and margin lesson explains why the small margin number misleads.
Store of value is not a stop loss
Holding a losing leveraged trade because "gold always comes back" is how accounts blow up. You may be right about the decade and still hit a margin call next week. You also pay swap, a daily financing charge, for every night the position stays open.
Volatility can be extreme even for a "safe" asset. In late Jan 2026 gold reached an all-time peak around $5,500. Then, as reported at the time, it fell nearly 10% in a single day on 30 Jan. On 0.10 lot, a move of that size would dwarf a $2,400 account. Size every trade from your stop, as the gold risk management lesson teaches.
Over long periods, yes. The World Gold Council measures a roughly 9% annualized dollar return from 1971 to 2025, ahead of consumer price inflation. Over shorter periods, and from a bad starting point, it can lose real value for years or decades.
No. Gold beat inflation over the full post-1971 era, but not in every stretch. From the 1980 peak it took about 45 years to regain its inflation-adjusted value, and in 2022 it was roughly flat while US inflation hit 9.1%.
Real yields rose sharply as the Fed raised rates, and the dollar strengthened by over 8%. Both usually weigh on gold. Strong central bank buying helped keep gold roughly flat instead of falling, according to the WGC.
Not safely. A leveraged position can be closed by a margin call long before any long-term recovery, and swap charges add up every night. The store-of-value argument applies to unleveraged holdings over years, not to CFD positions.
The PipsMorrow Team
A team of writers covering XAU/USD gold trading education. We focus on explaining the mechanics and risk management in a structured way, with no trade signals and no promotion of any specific broker.
Last updated
Gold price vs interest rates: why the real yield, not the headline rate, drives gold, where that link broke after 2022, and how to size trades around it.
10 min read
Read more →What is CPI in forex? Learn what the number measures, why the surprise moves the dollar and gold, when it lands in UTC, and how to size a trade around it.
9 min read
Read more →Gold jewelry vs gold bars: how purity, making charges, premiums, buy-back spreads and VAT make the same gram cost more to buy and return less when sold.
12 min read
Read more →Build on this article with the full gold trading curriculum, ordered from the basics to advanced topics, free.

