
Gold
Gold Price vs Interest Rates: Why Real Yields Matter More
Gold price vs interest rates: why the real yield, not the headline rate, drives gold, where that link broke after 2022, and how to size trades around it.
10 min read
Read more →
Gold jewelry vs gold bars: how purity, making charges, premiums, buy-back spreads and VAT make the same gram cost more to buy and return less when sold.
Buy a 10 g, 18-karat gold chain for $1,800 and sell it back the same afternoon, and you could walk out with about $770. Buy a 1-ounce gold bar for $4,120 and do the same, and you might get $3,960 back. Same metal, very different round trip.
That gap is the real story of gold jewelry vs gold bars. Neither is a scam, and neither is automatically the better buy. The difference comes from five separate layers: purity, making charges or premiums, the dealer's buy-back spread, tax, and the size of the item.
This article takes each layer in turn and then works a full round trip in US dollars. The numbers are illustrative, chosen to be round and easy to follow. They are not a quote, a forecast or a recommendation, so check real prices before you buy anything.
Every retail gold price starts from spot (the price for immediate delivery of wholesale gold). Spot is quoted in US dollars per troy ounce (the precious-metals ounce of 31.1034768 g, about 10% heavier than an everyday ounce). That is the same price you see on a chart as XAU/USD.
Spot is a wholesale price for large, high-purity bars. The benchmark is the London Good Delivery bar, which according to the LBMA's Good Delivery rules holds 350 to 430 fine troy ounces at a minimum fineness of 995.0 parts per thousand. Nobody sells a shopper a fraction of one of those bars at spot.
A retail price is therefore spot plus a stack of costs. For the arithmetic below, assume spot is $4,000 per troy ounce. Dividing by the grams in an ounce gives the value of one gram of pure gold.
What each variable means:
Everything else in this article is added to, or taken away from, that $128.60 per gram. Why spot itself moves is a separate subject, covered in the lesson on what moves the gold price.
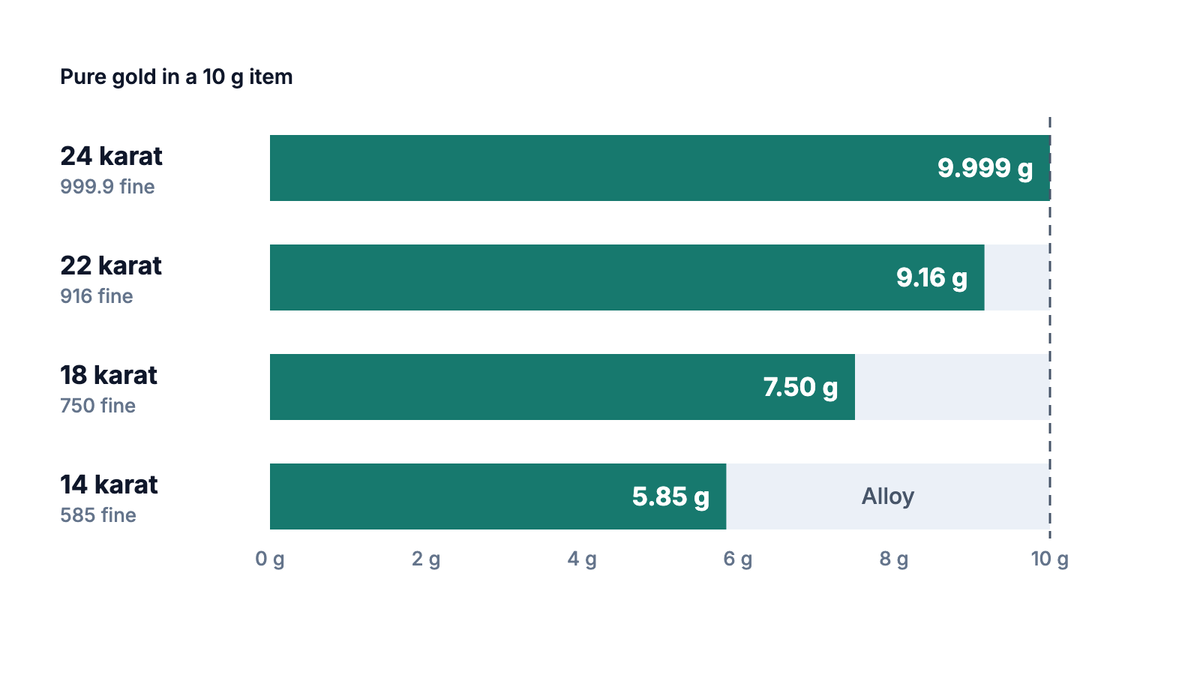
Pure gold is soft, so most jewelry is an alloy mixed with silver, copper or other metals. Purity is written two ways. Karat counts parts of gold out of 24, and fineness counts parts per thousand.
The fineness numbers are standardized. According to the London Assay Office's hallmarking guidance, UK assay offices can hallmark gold at 375, 585, 750, 916, 990 and 999, the standards set in the Hallmarking Act 1973. Many investment bars are stamped 999.9, meaning 99.99% gold.
| Purity | Fineness | Gold in a 10 g item | Metal value at $128.60/g |
|---|---|---|---|
| 24 karat (bar) | 999.9 | 9.999 g | $1,285.90 |
| 22 karat | 916 | 9.16 g | $1,178.00 |
| 18 karat | 750 | 7.50 g | $964.52 |
| 14 karat | 585 | 5.85 g | $752.33 |
The point is simple but easy to miss. A 10 g, 14-karat ring holds barely more than half the gold of a 10 g bar. Comparing price per gram of item, instead of price per gram of gold, makes jewelry look cheaper than it is.
Once you know the gold content, the next layer is what the seller charges above it. Bars and jewelry use different words for this, and the sizes are very different.
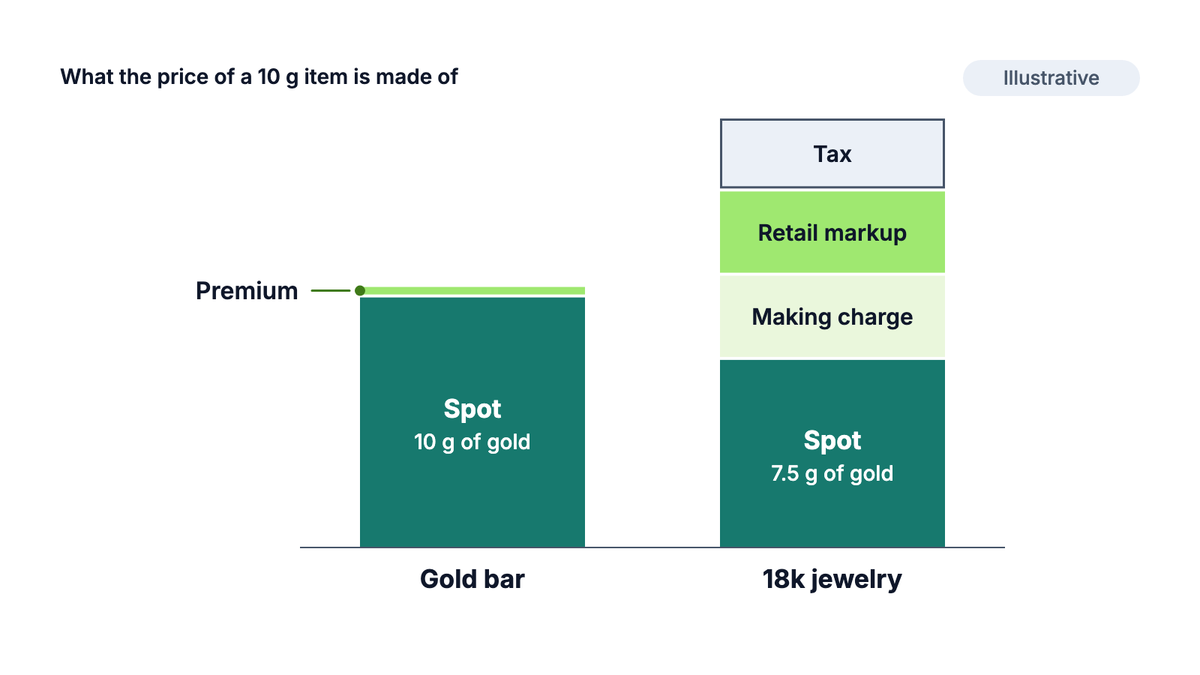
A piece of jewelry carries a making charge (also called a fabrication or labor charge) for design, casting, polishing and finishing. On top of that sits the retailer's markup, which pays for the shop, stock, staff and profit. Some markets show the making charge as its own line, while others fold everything into one tag price.
Either way, the charge pays for work, not metal. In our example the 18-karat chain costs $1,800 but contains $964.52 of gold. The other $835.48, about 87% above metal value, is craft and retail cost.
Bullion bars and coins are priced as spot plus a premium, a percentage or fixed amount that covers refining, minting, distribution and the dealer's margin. Premiums are usually far smaller than jewelry markups, because a plain bar needs little labor per gram.
Size matters a lot. Making a 1 g bar costs roughly as much as making a much heavier one, so the fixed cost is spread over less gold. That is why small bars and coins carry higher premiums per gram than 1 oz bars, and 1 oz bars higher than 1 kg bars.
| Product | Illustrative premium over spot | Why |
|---|---|---|
| 1 kg bar | Lowest, often around 1-2% | Fixed costs spread over 32.15 troy ounces |
| 1 oz bar | Low, e.g. 3% | Standard size with wide dealer competition |
| 1 oz bullion coin | Somewhat higher than a 1 oz bar | Minting detail and design |
| 1 g bar | High, e.g. 12% or more | Packaging and minting cost per gram is large |
Coins can drift into collector pricing. The EU definition of investment gold coins, covered below, explicitly excludes coins normally sold for more than 80% above the value of their gold. Past that point, you are paying for rarity, not metal.
The second half of any round trip is the price a dealer pays you. The gap between a dealer's selling price and buying price is the buy-back spread, and it is much wider for jewelry than for bars.
For the worked example, assume a dealer buys the 1 oz bar back at 1% below spot and buys the chain as scrap at 80% of its melt value. Both are round assumptions, so ask a dealer for real bids before you rely on any figure.
Tax can widen the gap further, because many countries treat investment gold differently from jewelry. The rules below are examples only. They change over time, so check your own tax authority or a qualified adviser.
The effect is easy to see. Where jewelry carries 20% VAT and a qualifying bar carries none, the $1,800 chain costs $2,160 at the till. You don't get the VAT back when you sell to a dealer, so it adds straight to the round-trip cost.
Tax changes
Treat the list above as a snapshot of how the rules differ, not as tax advice. Thresholds, coin lists and rates are revised, and capital gains tax on selling can also apply in some countries.
Now put the layers together. The assumptions are spot at $4,000 per troy ounce, which is $128.60 per gram, and no change in spot between buying and selling. Tax is left out of the main table and shown separately.
| Step | 1 oz bar (999.9) | 1 g bar (999.9) | 10 g, 18k chain |
|---|---|---|---|
| Gold content | 31.10 g | 1.00 g | 7.50 g |
| Metal value at spot | $4,000.00 | $128.60 | $964.52 |
| You pay | $4,120.00 (3% premium) | $144.04 (12% premium) | $1,800.00 (tag price) |
| Dealer pays you | $3,960.00 (1% under spot) | $126.03 (2% under spot) | $771.62 (80% of melt) |
| Round-trip loss | $160.00 | $18.00 | $1,028.38 |
| Loss as % of price paid | 3.9% | 12.5% | 57.1% |
The more useful question is how far spot must rise before selling gets your money back. Divide what you paid by what the dealer pays per dollar of spot.
What each variable means:
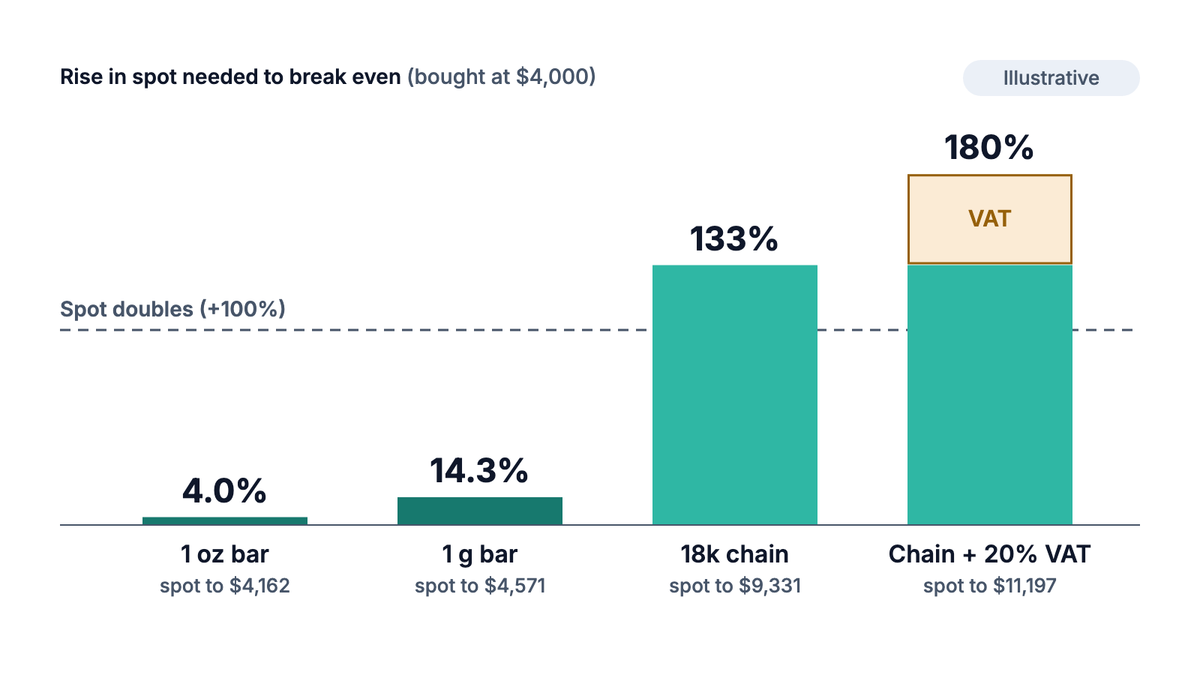
The numbers point to a plain conclusion. A large bar needs only a small move in gold to break even, while jewelry needs gold to more than double. That doesn't make jewelry a bad purchase. It means jewelry is something you buy to wear, with some metal value left at the end.
Trading XAU/USD, usually as a CFD (contract for difference, a contract that pays the price change without delivering metal), removes every physical layer above. There is no purity to check, no making charge, no premium and no dealer bid. Instead you pay a spread (the gap between the buy and sell price) and a swap (an overnight financing charge or credit).
Take a 0.01 lot (a standard lot of gold is 100 troy ounces, so 0.01 lot is 1 oz) at $4,000. According to the site's calculators, the position is worth $4,000. At 1:500 leverage (trading a position larger than your deposit), the margin (the deposit held against the position) is $8.00, or 0.33% of a $2,400 account.
If the spread is 30 pips, or $0.30 on gold, the entry cost on that 1 oz position is $0.30. Compare that with the $160 round trip on the 1 oz bar. But the swap is charged every night the trade stays open, so holding for months can cost far more than the spread.
The bigger difference is risk. A $40 move in gold makes or loses $40 on 0.01 lot, and with leverage that loss comes out of a small deposit. You can lose money faster than a bar owner, and you never own any metal. The guide What Is XAU/USD Gold Trading? and the lesson on leverage and margin explain those risks in full.
Brokers publish spread, swap and contract size in their specs, and the article on reading a broker's gold specs shows where to find each one. The lesson What a Trade Really Costs adds them up per round turn.
Try it now
Check the XAU/USD side of the comparison with your own numbers. Enter a price, lot size and leverage to see the position value and the margin it ties up.
Jewelry adds a making charge and retail markup that can nearly double the metal value, and it often holds less gold per gram because it is 22k, 18k or 14k. In many countries it also carries VAT or sales tax that investment bars avoid.
Usually not. Most buyers pay for the gold content only, often at a discount to melt value. Branded or antique pieces can sell above melt, but that depends on finding a buyer who values the design.
Minting, packaging and handling cost about the same per piece whatever the weight. On a 1 g bar those fixed costs are spread over very little gold, so the premium per gram is much higher than on a 1 oz or 1 kg bar.
As a way to hold gold for its price, jewelry is costly because of the round trip. In the illustrative example here, an 18k chain needed spot to rise about 133% to break even, against about 4% for a 1 oz bar.
It depends on the country. The EU and the UK exempt qualifying investment gold from VAT, and Australia treats investment-form gold of 99.5% fineness or more as GST-free or input taxed. India charges 3% GST on all gold, so check your own tax authority's rules.
The PipsMorrow Team
A team of writers covering XAU/USD gold trading education. We focus on explaining the mechanics and risk management in a structured way, with no trade signals and no promotion of any specific broker.
Last updated
Gold price vs interest rates: why the real yield, not the headline rate, drives gold, where that link broke after 2022, and how to size trades around it.
10 min read
Read more →Gold as a store of value, honestly: why it kept purchasing power over decades, when it lost real value for years, and what that means on an XAU/USD chart.
9 min read
Read more →Gold support and resistance at gold's own scale: size zones from ATR, score each XAU/USD level with five checks, then set the stop and lot size from it.
10 min read
Read more →Build on this article with the full gold trading curriculum, ordered from the basics to advanced topics, free.

