Technical analysis
Multi Timeframe Analysis: A Top-Down Routine for Any Pair
Multi timeframe analysis lets a higher chart set direction and a lower one set timing. Learn a three-step top-down routine you can use on any pair.
10 min read
Read more →
Gold support and resistance at gold's own scale: size zones from ATR, score each XAU/USD level with five checks, then set the stop and lot size from it.
Most gold support and resistance levels don't fail because the idea was wrong. They fail because they were drawn at the wrong scale. A trader brings a habit from EUR/USD, draws a thin line at $4,300, puts a stop a few dollars below it, and gets stopped by an ordinary wick.
This article takes the general method you already know and applies it to gold's numbers. You'll size a zone from volatility, score each level with five checks, and turn the level into a stop and a lot size. Throughout, treat a level as a place where a reaction is more likely, never as a signal that one will happen.
Before you start
The mechanics of levels are covered in the lesson Support and Resistance That Hold, and the gold version sits in Technical Analysis for Gold. This article assumes both and goes further on gold specifically.
XAU/USD quotes the price of one troy ounce (31.1035 g) of gold in US dollars. On most platforms one lot (a standard contract size) is 100 troy ounces. The site counts a pip (the smallest price step we measure) as $0.01 on gold, so one pip on one lot is worth $1.00.
That arithmetic changes how a level feels. A zone $12 wide is 1,200 pips on gold. The same idea on EUR/USD would be a zone a few pips wide. Neither is wrong, but a trader who thinks in EUR/USD pips will draw gold zones that are far too thin.
| EUR/USD | XAU/USD | |
|---|---|---|
| Price step counted as a pip | 0.0001 | $0.01 |
| Value of 1 pip on 1 lot | $10.00 | $1.00 |
| A typical intraday zone | A few pips | Often $10 or more, so over 1,000 pips |
| What a 5-pip zone means | A reasonable intraday band | 5 cents, crossed many times a minute |
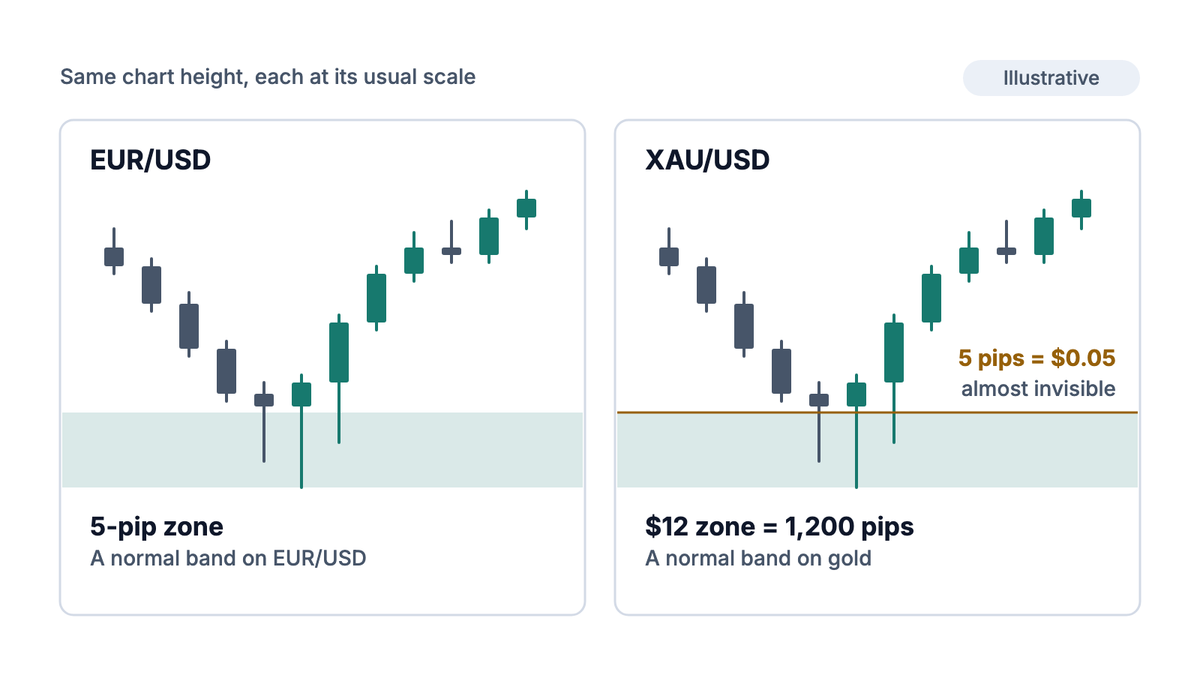
The point to carry forward is simple. On gold, a level is a band often $10 or more wide, and every stop and size decision has to respect that width.
A level matters when enough participants are willing to act there. On gold, four sources produce most of the levels worth drawing. Each one has a reason you can say out loud, which is the test the core lesson sets.
Round hundreds are the most visible levels on the gold chart, and round fifties come second. Orders, option strikes and headlines cluster there. According to Outlook Business, spot gold first traded above $3,000 on 14 Mar 2025, touched $3,004.86, and slipped back below the figure within the same session.
That behavior is typical of a famous number. Price reaches for it, pokes through, and often pulls back before deciding. Expect the wick through the figure rather than a clean touch.
These are unambiguous. The previous day's high is a number, not a judgment, so a rule built on it gives everyone the same answer. That makes it testable in a way that a hand-drawn line isn't.
A swing high or low that is visible on the daily or 4-hour chart carries more weight than one only the 5-minute chart shows. Mark these first, then refine them on a lower timeframe. The lesson Multi-Timeframe Analysis explains how to pair the two.
A support that breaks often acts as resistance on the retest, because trapped buyers sell to get out at break-even. At an all-time high the opposite applies: no one above is underwater, so there is no overhead supply to create resistance.
| Source | Why orders gather there | Strength on gold |
|---|---|---|
| Round hundred, such as $4,300 | Visibility, option strikes, headlines | Strong, but expect wicks through it |
| Round fifty, such as $4,250 | Same effect, less attention | Moderate |
| Previous day or week high and low | Everyone sees the same number | Moderate to strong, and testable |
| Daily or 4-hour swing | Unfinished business from a sharp reversal | Strong when recent |
| Broken level on the retest | Trapped traders exiting at break-even | Moderate, fades with each test |
If you have more than five lines on the chart, you're describing the past. Keep the ones with a named source and erase the rest.
Average True Range (ATR) measures how far price typically travels in one bar. It is the honest way to size a zone on gold, because it adapts as volatility changes. The lesson Volatility: ATR and Bands covers the calculation.
As a working rule, a zone wider than about a third of the daily ATR is too vague to trade from. That isn't a law of markets. It is a practical limit, because a very wide zone forces a very wide stop and a very small position.
What each variable means:
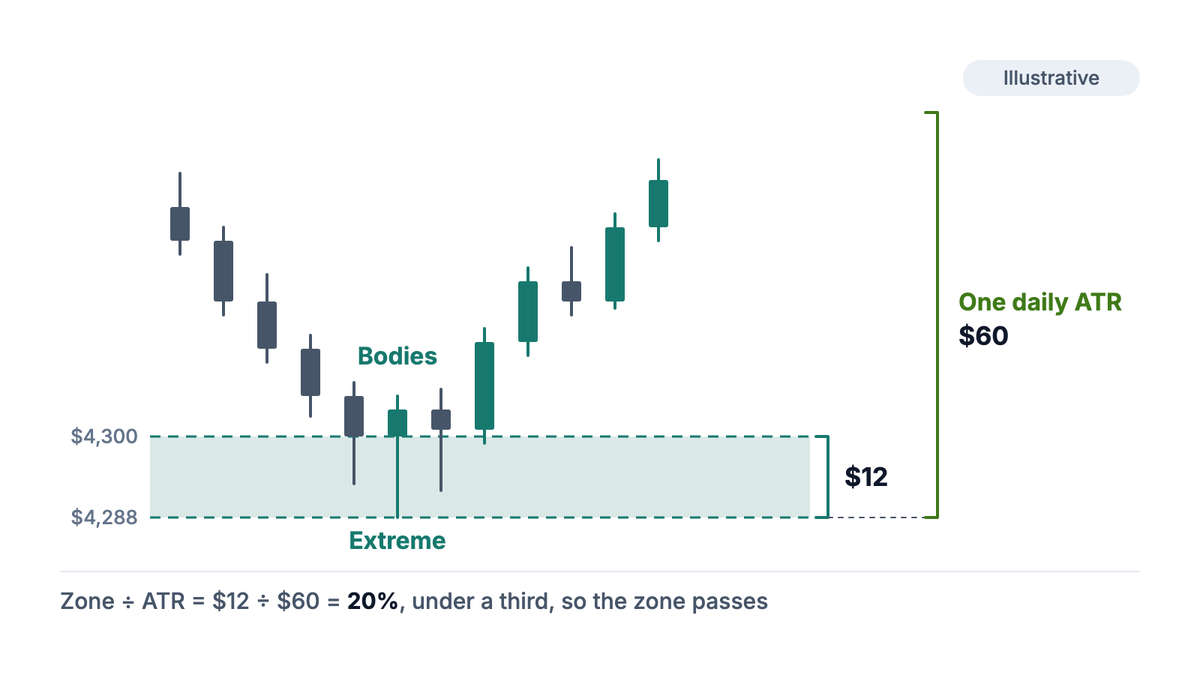
The zone width is the first number your trade plan depends on. Get it from the chart and the ATR, not from a pip count you're used to.
A level is a hypothesis. These five checks don't make it right. They sort the levels worth watching from the ones that only look good in hindsight. Score each level before the session opens, not while price is approaching it.
The fifth check matters more on gold than on most instruments. A data release can move gold through several zones in one candle, and the spread (the gap between the buy and sell price) can widen at the same moment. The lesson Economic Events That Move Gold lists the releases worth knowing.
A level is a probability, not a signal
A level that scores five out of five can still break by $60 or more in a session. The checks raise the odds that a reaction is worth watching. They say nothing certain about what price will do, and they never replace a stop.
Keep a record of every level you mark, including the ones that failed. A level that held twice and broke three times has a 40% record, and knowing that is worth more than remembering the two wins.
Here is an illustrative scenario using the site's shared account figures. The prices are examples for the arithmetic, not a view on where gold is going.
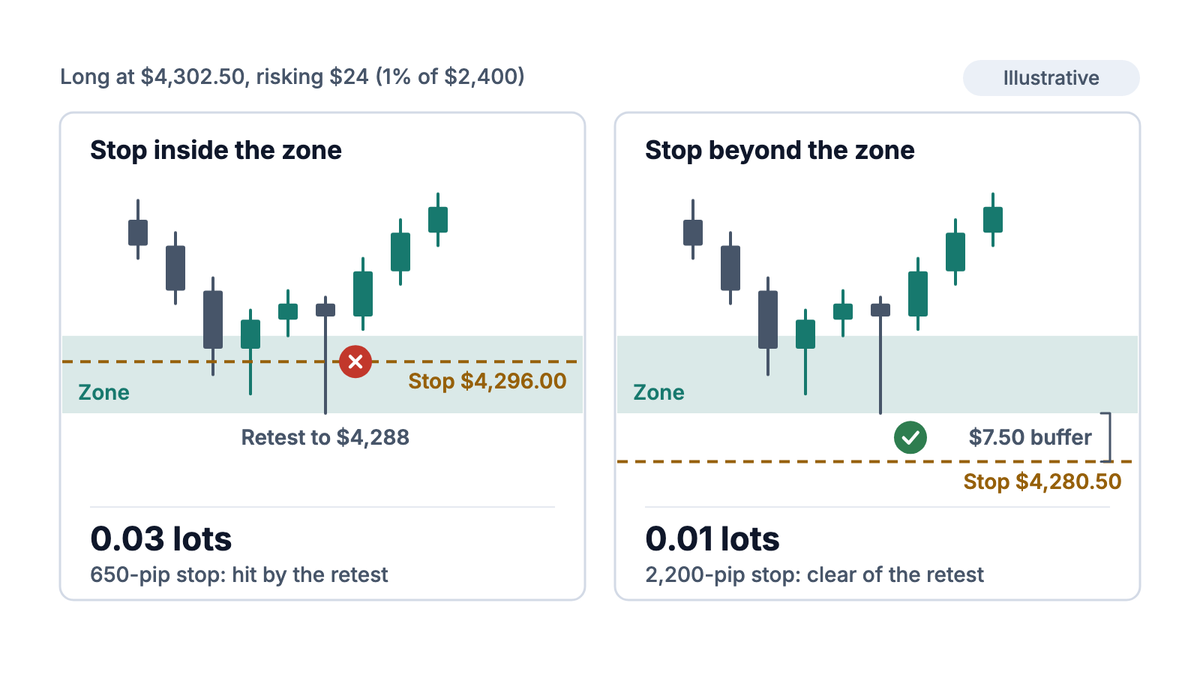
The stop sits $22.00 below the entry, which is 2,200 pips. The formula gives 0.0109 lots, and the lot size calculator rounds down to 0.01 lots. The money at risk is $22, just under the $24 budget.
What each variable means:
Now compare a trader who drew a thin line at $4,300 and put the stop at $4,296.00. That stop is only 650 pips away, so the calculator allows 0.03 lots, three times the size. It looks like a tighter, smarter trade.
The problem is that $4,296.00 sits inside the zone. An ordinary retest to the swing low at $4,288.00 takes the stop, even if the level then holds. If the trader widens the stop to the correct place but keeps 0.03 lots, the loss at the stop becomes $66, which is 2.75% of the account.
| Approach | Stop distance | Lots | Loss at the stop | Share of $2,400 |
|---|---|---|---|---|
| Zone-based stop, sized from it | 2,200 pips | 0.01 | $22.00 | 0.92% |
| Line-based stop inside the zone | 650 pips | 0.03 | $19.50 | 0.81%, but likely hit by noise |
| Zone stop, line-based size kept | 2,200 pips | 0.03 | $66.00 | 2.75% |
| Zone stop at the shared 0.10 lot | 2,200 pips | 0.10 | $220.00 | 9.17% |
Try it now
Enter your balance, risk percentage and stop in pips or price. The lot size calculator handles gold's 100-ounce contract and rounds down to a size you can trade.
The lesson from the table is that the zone decides the stop, and the stop decides the size. For more on stop placement, see Where a Stop Belongs.
Every one of these mistakes treats the level as more certain than it is. Keep it a probability and most of them disappear.
Start on the daily chart and mark recent swing highs and lows, round hundreds, and the previous week's high and low. Keep only levels with a named reason, then refine them on the 4-hour chart. Two or three levels per chart is usually enough.
Wide enough to cover the extreme of the reaction and the candle bodies, which on gold is often $10 or more at current prices. Check it against the daily ATR. If the zone is wider than about a third of the ATR, it's too vague to plan a trade from.
They matter because many participants watch them, not because the numbers themselves are special. Round hundreds such as $4,300 draw orders and attention, so reactions there are common. Expect price to wick through the figure before it settles.
Beyond the far edge of the zone, plus a buffer sized from volatility, never on the round number itself. Then size the position from that stop distance so the loss stays within your risk budget.
A level tells you where a reaction is more likely, not that it will happen. Pair it with a structural trigger and a stop. Filters such as RSI divergence on gold charts can add context, but no level is a signal on its own.
The PipsMorrow Team
A team of writers covering XAU/USD gold trading education. We focus on explaining the mechanics and risk management in a structured way, with no trade signals and no promotion of any specific broker.
Last updated
Multi timeframe analysis lets a higher chart set direction and a lower one set timing. Learn a three-step top-down routine you can use on any pair.
10 min read
Read more →Reversal candlestick patterns only mean something in the right place. Learn the few that matter, the context each needs, and how to set a stop and size.
8 min read
Read more →How to size a position on gold to the risk you can afford: a five-step routine, worked numbers on a $2,400 account and the traps that turn 1% into 10%.
8 min read
Read more →Build on this article with the full gold trading curriculum, ordered from the basics to advanced topics, free.

