
Technical analysis
Moving Average Crossover: What It Catches and Misses
A moving average crossover signals a trend change late by design. See what it catches, what it misses, why it lags and how to test your settings.
11 min read
Read more →
Multi timeframe analysis lets a higher chart set direction and a lower one set timing. Learn a three-step top-down routine you can use on any pair.
Multi timeframe analysis means reading the same market on more than one chart, so that a slow chart tells you the direction and a fast chart tells you when to act. Two charts of one pair can look opposite and both be right, because each answers a different question. This article gives you a three-step routine that works on any forex pair or on gold.
The example uses an assumed EUR/USD chart, and every price in it is made up. Nothing here is a trade signal. The aim is to show how the routine works, and how the chart you choose for your stop changes your position size.
Every candle on a chart summarizes a fixed span of time. A daily candle covers a day, and a 1-hour candle covers an hour. The same hour of trading appears inside both charts, but the daily chart hides almost all of its detail. That is useful, because it strips out noise and shows the bigger structure.
The trouble is that no single chart gives you everything. A daily chart shows the trend but is too coarse to place a tight stop. A 5-minute chart gives a precise entry but cannot tell you whether you are trading with the market or against it. Multi time frame trading solves this by splitting the job between charts.
| Role | Question it answers | Example timeframe |
|---|---|---|
| Context | Which way is the market moving, and where are the big levels? | Daily |
| Setup | Has price reached a level where a trade makes sense? | 4-hour (H4) |
| Trigger | Is there a clear entry and a close stop right now? | 1-hour (H1) |
The lesson on multi-timeframe analysis covers the theory step by step. Here we turn it into a routine you can repeat. If you are new to reading direction, start with defining a trend you can trade.
Pick your timeframes from how long you plan to hold a trade, not from what looks comfortable. A trade meant to last two or three days belongs on the daily, H4 and H1 charts. A trade meant to last a few hours belongs on H1, M15 and M5 instead.
Keep a gap of about four to six times between neighbors. A daily chart is six H4 candles, and an H4 candle is four H1 candles. Closer than that, the higher chart is just a smoother copy of the lower one. Further apart, the two charts stop relating, and the trigger chart tells you nothing about the setup.
| Style | Context | Setup | Trigger |
|---|---|---|---|
| Position trading | Weekly | Daily | H4 |
| Swing trading | Daily | H4 | H1 |
| Intraday trading | H4 | H1 | M15 |
| Scalping | H1 | M15 | M5 |
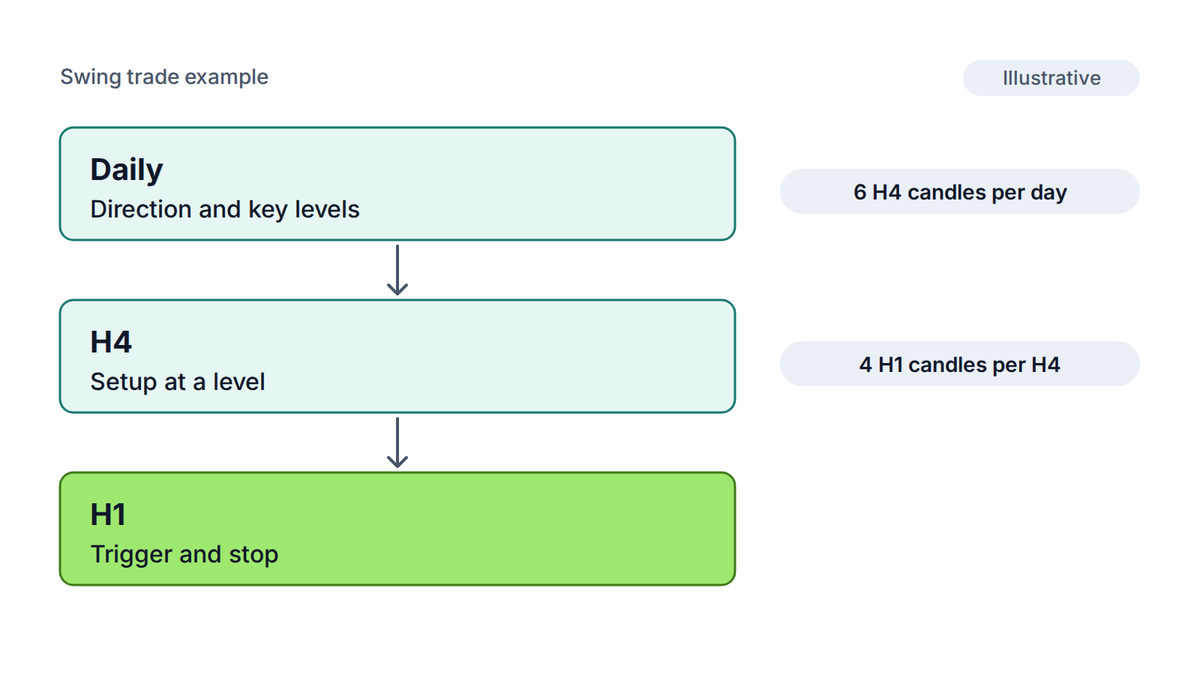
Stop at three charts. A fourth adds another opinion, not another piece of information, and you will start to find charts that agree with what you already want to do. Two charts are enough for many traders.
Work from the slowest chart to the fastest, and never skip a step. Each step has a yes or no output, and a no at any step means you stop and wait.
The trigger is the only step that decides when you act. The first two steps decide whether you are allowed to act at all. That split is what keeps you from trading every small wiggle.
Write it down
Before each trade, note one line per chart: "Daily up, H4 at support, H1 closed above the last lower high." If you cannot fill in all three lines, you do not have a setup.
Say EUR/USD is trading near 1.0935. All prices here are assumed. Here is what each step finds.
A buy at 1.0935 has a target at the daily swing high of 1.1010, which is 75 pips away. A pip is the fourth decimal place on most pairs, so 1.0935 to 1.1010 is 75 pips. The stop loss goes beyond a swing point that, if broken, shows the idea is wrong. The next section shows why the choice of swing point matters.
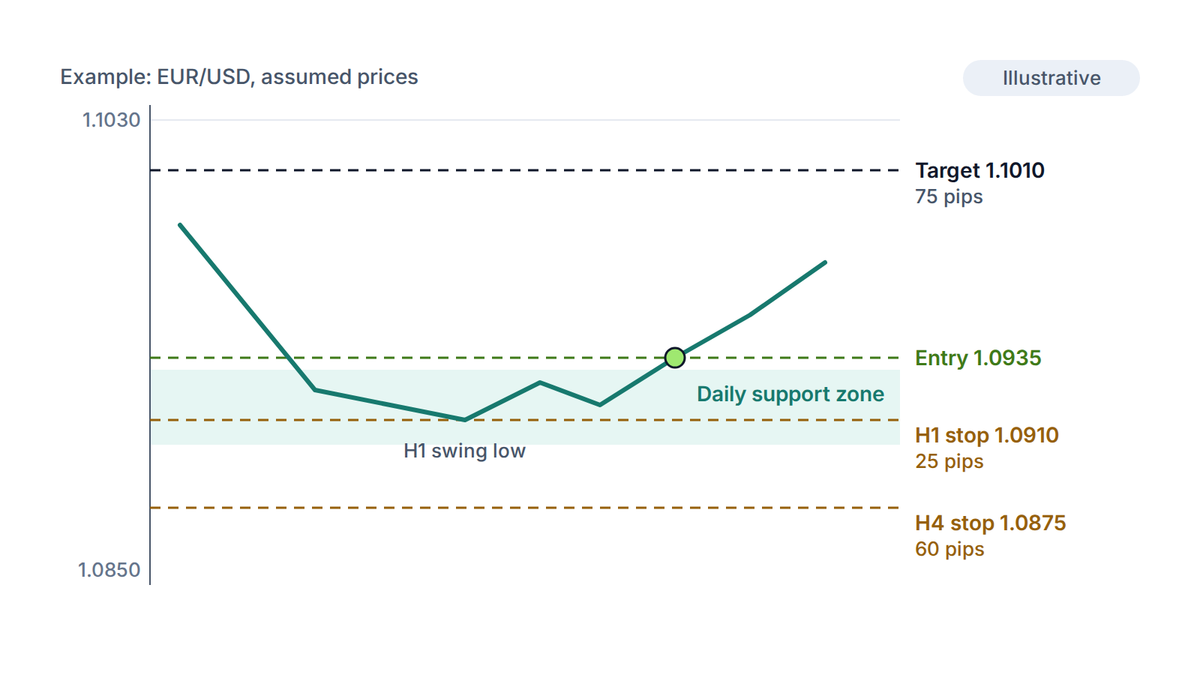
You now have two honest stop choices. A stop loss just below the H1 swing low at 1.0910 is 25 pips from the entry. A stop below the H4 low at 1.0875 is 60 pips away. Both are valid, but they lead to different trades.
Take the shared example account of $2,400 with 1% risk, which is $24 per trade. On EUR/USD one pip is worth about $10 per standard lot (a lot is 100,000 units of the base currency). Divide the $24 by the stop in pips and by $10 to find the lot size, then round down to the next 0.01.
| Stop from | Stop distance | Lot size | Money at risk | Reward to risk (75 pips) |
|---|---|---|---|---|
| H1 swing low (1.0910) | 25 pips | 0.09 | $22.50 | 3.0 to 1 |
| H4 swing low (1.0875) | 60 pips | 0.04 | $24.00 | 1.25 to 1 |
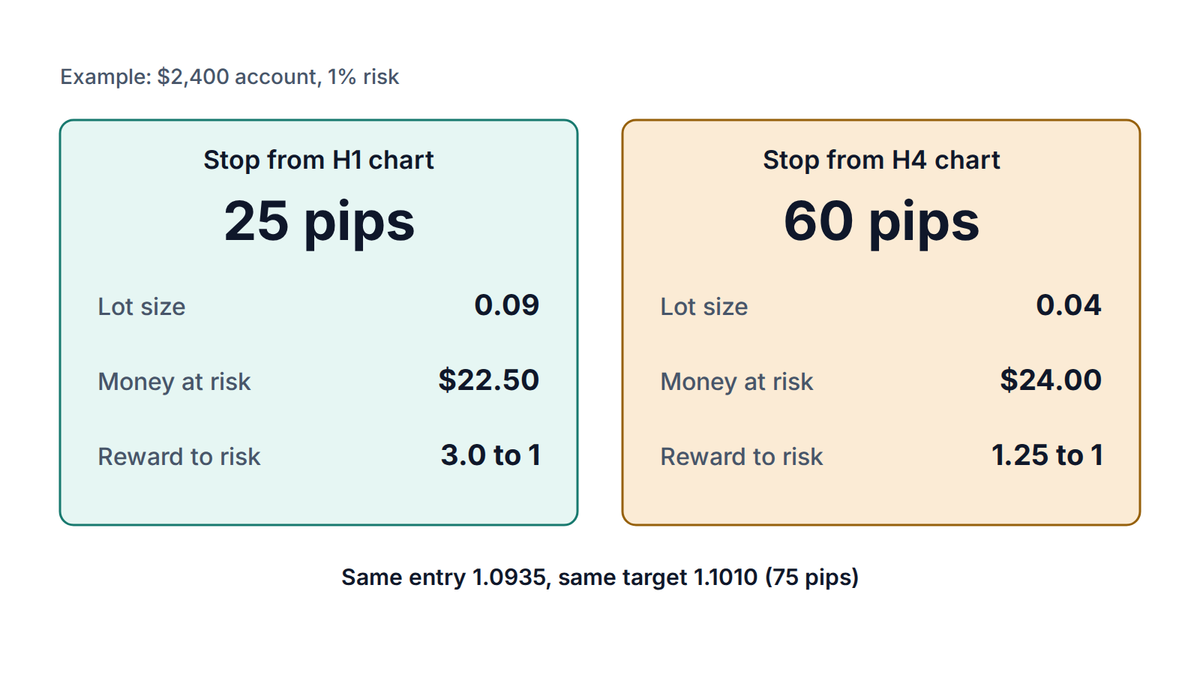
The tighter stop looks better on paper, with a ratio of 3 to 1. But it sits inside the ordinary noise of the H4 chart. The ATR indicator shows how far price normally travels, and a stop closer than that gets hit by random swings. The wider stop is safer against noise but pays only 1.25 to 1 on this target.
There is no free choice here. Pick the chart that matches your holding period and use its swing points consistently. Our article on stop loss in trading covers placement in more depth, and the lot size calculator does the arithmetic for any stop you choose.
Disagreement is normal, and it is the main reason to use more than one chart. The skill is deciding in advance what you will do, so that you do not decide in the middle of a trade. The simplest rule is that the higher timeframe sets the bias.
| Daily | H4 or H1 | What to do |
|---|---|---|
| Up | Up | Look for a trigger in the direction of the trend |
| Up | Pulling back | Wait for the pullback to reach a level, then look for a trigger |
| Up | Clearly down, through a level | Stand aside until the daily trend or level is clear again |
| Sideways | Any | No trade, or trade only the range edges with a smaller size |
A pullback on the lower chart is not a disagreement. It is the setup you were waiting for. A real disagreement is when the lower chart breaks a level that the higher chart treats as important. In that case the safest answer is often to wait.
Counter-trend trades are possible, but treat them as a different trade. Use a smaller size, a nearer target and an earlier exit. The higher chart is still pushing the other way.
The most common error is timeframe shopping. You have a trade idea, the H1 chart does not support it, so you flip to M15, then M5, until one chart agrees. The analysis was not the reason for the trade, only a decoration for it.
A simple guard is a journal. Record the three charts you used and the one-line reading for each, then check later whether trades that followed the routine did better than those that did not. Our trading journal template gives you a layout to start from.
Risk note
A neat top-down read does not make a trade safe. Price can break any level, and leveraged trading can lose money quickly. Size every trade from your stop loss and risk only an amount you can afford to lose.
It is the practice of reading the same market on two or three charts of different lengths. A higher chart gives the trend and key levels, and a lower chart gives the entry timing and the stop. Each chart answers one question.
Match them to your holding period and keep each four to six times shorter than the one above. Swing traders often use daily, H4 and H1. Intraday traders often use H4, H1 and M15.
Two or three. Beyond that you add opinions instead of information, and it becomes easy to find a chart that agrees with the trade you already want.
Let the higher timeframe set the bias. If the lower chart only pulls back, wait for it to reach a level and then look for a trigger. If it breaks an important level, stand aside until the picture is clear.
The routine is the same on gold (XAU/USD) as on forex pairs, because it only relies on trend, levels and triggers. Gold moves in larger dollar amounts, so check your stop distance and lot size against the contract before you trade.
The PipsMorrow Team
A team of writers covering XAU/USD gold trading education. We focus on explaining the mechanics and risk management in a structured way, with no trade signals and no promotion of any specific broker.
Last updated
A moving average crossover signals a trend change late by design. See what it catches, what it misses, why it lags and how to test your settings.
11 min read
Read more →Reversal candlestick patterns only mean something in the right place. Learn the few that matter, the context each needs, and how to set a stop and size.
8 min read
Read more →Gold support and resistance at gold's own scale: size zones from ATR, score each XAU/USD level with five checks, then set the stop and lot size from it.
10 min read
Read more →Build on this article with the full gold trading curriculum, ordered from the basics to advanced topics, free.

