
Tools
Backtesting Trading Strategies Without Fooling Yourself
Backtesting trading strategies means replaying rules on old charts. Learn how to do it step by step and avoid the traps that make a weak system look strong.
12 min read
Read more →
A moving average crossover signals a trend change late by design. See what it catches, what it misses, why it lags and how to test your settings.
A moving average crossover happens when a faster moving average passes through a slower one. Many traders read it as a sign that a trend has started or ended. It can be useful, but it always arrives late, and in a sideways market it can fire again and again with nothing to follow.
This article shows what a crossover catches, what it misses and why it lags. It uses one assumed gold (XAU/USD) price series so you can see the numbers behind each claim. Nothing here is a trade signal, and every price is made up for the example.
A moving average is the average closing price of the last N bars, recalculated on every new bar. Plot it and you get a smooth line that follows price at a distance. The longer the period, the smoother the line and the further it trails. The lesson on moving averages covers the basics.
A crossover uses two of those lines at once: a fast one with a short period and a slow one with a long period. When the fast line moves above the slow line, recent prices are higher than the longer-run average. When it falls below, the opposite is true. That is all a crossover says.
| Event | What happens | Common reading |
|---|---|---|
| Bullish crossover | Fast average crosses above slow average | Upward momentum is building |
| Bearish crossover | Fast average crosses below slow average | Downward momentum is building |
| Golden cross | 50-bar average crosses above 200-bar average | A slow, long-term bullish crossover |
| Death cross | 50-bar average crosses below 200-bar average | A slow, long-term bearish crossover |
The exact pair is a choice, and the choice shapes how the signal behaves. Fast pairs signal early and often. Slow pairs signal late and rarely. The rest of this article explains why that trade-off exists.
A moving average is built entirely from past prices. It cannot know where the next bar will close. By the time the fast line has dragged itself through the slow line, price has already moved, and the crossover confirms a move that is under way instead of predicting one.
You can put a number on the delay. A simple moving average of N bars gives every bar in its window equal weight, so its center of gravity sits in the middle of the window. That is about (N − 1) ÷ 2 bars ago.
What each variable means:
A 10-bar SMA trails by about 4.5 bars and a 30-bar SMA by about 14.5. A crossover happens only after the slow line has been dragged within reach of the fast one, so the signal inherits much of the slower line's delay. The 200-bar average behind the golden cross trails by almost 100 bars.
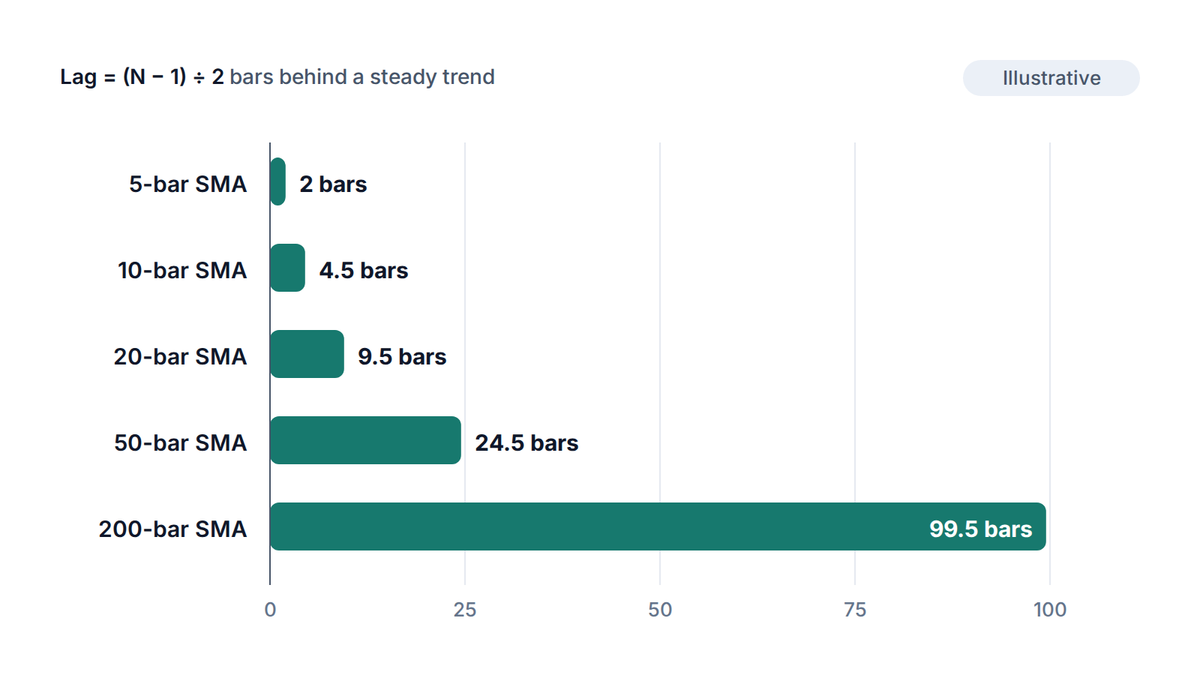
Lag is not a flaw you can tune away. It is the price of smoothing. A line that smooths out noise must lean on older data, and a line that leans on older data is late. Shorten the period and you cut the delay, but you also let more noise through.
Take an assumed 80-bar gold chart. Price drifts in a tight range near $4,300 for 35 bars, then climbs about $6 per bar to a peak of $4,452 at bar 60. After the peak it falls about $5 per bar. We use a 10-bar and a 30-bar simple moving average (SMA), both calculated on closing prices.
The 10-bar line crosses above the 30-bar line at bar 36, when price closes at $4,308. That is the first bar of the climb, so a buyer on the signal enters almost at the start. The flat range before it helps: both averages sit near $4,300, so a small push is enough to separate them.
The exit tells a different story. Price peaks at bar 60, but the 10-bar line does not cross back below the 30-bar line until bar 73, when price closes at $4,383. By then price has fallen $69 from the top.
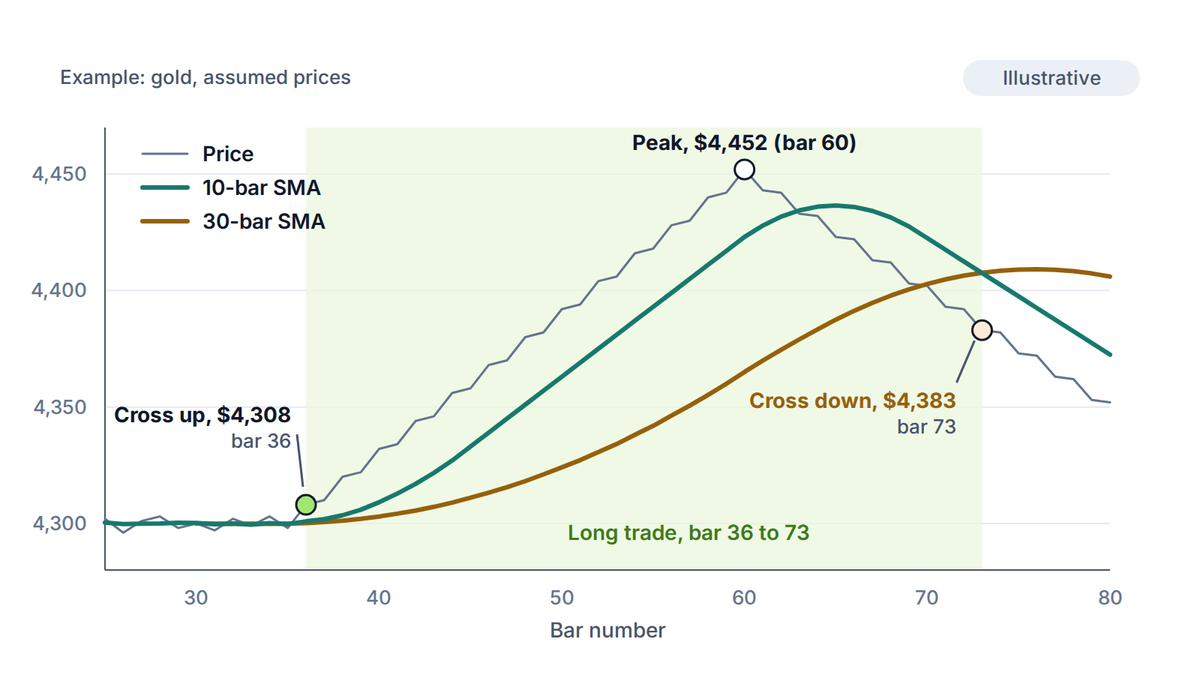
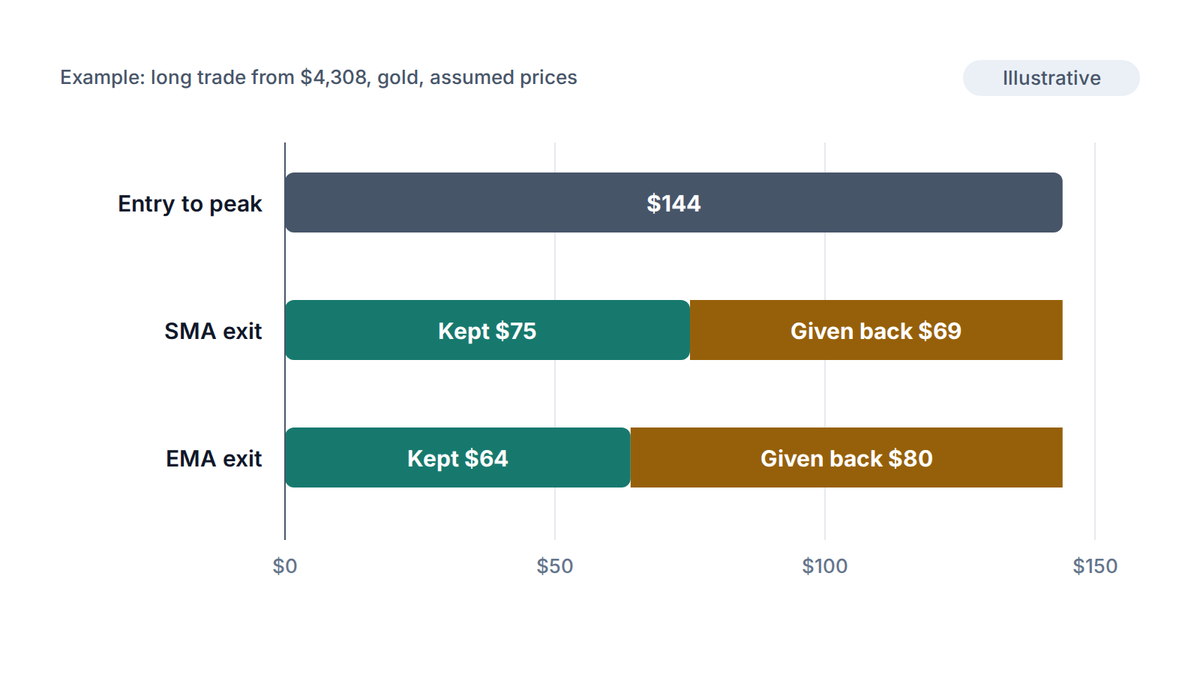
Here is the scorecard for a long trade taken at the cross up and closed at the cross down. Entry at $4,308, exit at $4,383. The trade makes $75 of price movement. The whole run from entry to peak was $144, so the crossover kept about half of it. The other $69 went back to the market while the averages caught up.
That is what a crossover catches well. It keeps you on the right side of a long, steady move, and it saves you from picking a top or bottom. It trades away the first and last part of the trend to do so.
The same series also shows the weak side. Before the climb, in the flat range, the 10-bar and 30-bar lines hug each other. Over bars 31 to 35 the 10-bar line crossed the 30-bar line five times in a row. Each cross looked like a signal, and none led anywhere. Traders call these false signals whipsaws.
Suppose you bought on the up crosses at bar 32 ($4,302) and bar 34 ($4,303) and sold on the next down crosses at bar 33 ($4,299) and bar 35 ($4,298). The two losses are $3 and $5. They look small, but this happens often in a range, and the costs add up. Each trade also pays the spread (the gap between the buy and sell price), so a whipsaw loses more than the chart shows.
A crossover is not a reason to ignore risk
Price can gap through your exit around major data releases, so a crossover exit is not a stop loss. Place a stop of your own, and read how to place a stop loss before you trade any signal.
The fix is not a cleverer crossover. It is knowing which kind of market you are in. A trend filter, such as checking the trend on a higher timeframe, keeps you from trading every cross in a range. You accept fewer trades in return for fewer false ones.
An EMA crossover uses exponential moving averages (EMAs) instead of simple ones. An EMA gives more weight to recent bars, so it hugs price more closely than an SMA of the same length. The weight on the newest bar is 2 ÷ (N + 1), which is about 18% for a 10-bar EMA and 6.5% for a 30-bar EMA.
What each variable means:
On the same gold series, the 10/30 EMA lines read $4,364.50 and $4,335.10 at bar 50, while the SMA pair reads $4,363.00 and $4,324.10. The EMA slow line sits closer to price, about $11 nearer. It tracks the trend more tightly, so crossovers tend to come a little earlier.
Earlier is not the same as better. In this series the EMA pair did cross up at bar 36, like the SMA pair, and it also flipped in the flat range at bars 34 and 35. On the way down it crossed at bar 76, three bars after the SMA pair, because the slow EMA had climbed closer to price, so the fast one had to fall further to cross it. The exit was worse: $64 kept against $75.
| Feature | SMA crossover | EMA crossover |
|---|---|---|
| Weighting | Every bar in the window counts the same | Recent bars count more |
| Lag | Higher | Lower, but not zero |
| Noise | Smoother, fewer false signals | Reacts to noise sooner |
| Best suited to | Slow trends and longer timeframes | Faster markets and shorter timeframes |
That is why a search for the best EMA crossover has no single answer. A pair that fits one market and one timeframe can lose on another. The data decides, not the label.
Before you trade a crossover, check how it behaves on past charts. The point is not to find the pair with the best result, because you can always find one by trying enough pairs. The point is to learn how the rule behaves in trends, in ranges and in bad stretches.
The backtesting article walks through this process in detail, including how a rule can look good on past data by accident.
A crossover gives an entry idea but no risk limit. You still decide where you are wrong and how much to lose if you are. A common choice is a stop below a recent swing low or a multiple of the ATR indicator, which measures the typical bar size.
Say you buy gold at the bar 36 signal and put a stop $20 below the entry. On the site's $2,400 account at 1% risk, the budget is $24. One lot of gold (100 ounces) moves $100 for every $1 in price, so a $20 stop costs $2,000 per lot. The budget therefore allows 0.012 lots, which rounds down to 0.01 lots, with a real risk of $20.
Try it now
Enter your balance, the risk percentage and the distance from your entry to your stop. The calculator returns the lot size, so the crossover sets the entry and your risk rule sets the size.
Keeping the risk per trade fixed matters most in a whipsaw run. If five signals in a row fail, a risk of $20 each takes $100 from the account. A size chosen by feel could take far more.
It is the point where a fast moving average crosses a slow one. A cross upward is read as rising momentum and a cross downward as falling momentum. Because averages use past prices, the signal confirms a move that has already begun.
No pair is best across all markets. Common choices include 9/21, 12/26 and 20/50, but each suits some conditions and fails in others. Test the pairs you like on a long stretch of past charts, include costs, and favor settings that still work when you nudge the numbers.
An EMA reacts faster, which cuts lag and increases false signals. An SMA is smoother and slower. Neither is better by default, and the answer depends on the market and the timeframe you trade.
In a sideways market the averages sit close together, so small price moves push the fast line back and forth across the slow one. The crossover cannot tell a real trend from noise, which is why traders pair it with a trend filter or a higher timeframe.
No. It describes what price has done, and it does not forecast what comes next. Treat it as a way to follow a trend with rules, and manage the risk of every trade yourself.
The PipsMorrow Team
A team of writers covering XAU/USD gold trading education. We focus on explaining the mechanics and risk management in a structured way, with no trade signals and no promotion of any specific broker.
Last updated
Backtesting trading strategies means replaying rules on old charts. Learn how to do it step by step and avoid the traps that make a weak system look strong.
12 min read
Read more →Multi timeframe analysis lets a higher chart set direction and a lower one set timing. Learn a three-step top-down routine you can use on any pair.
10 min read
Read more →The ATR indicator measures how far price normally moves. Learn how to read it, how it is calculated and how to size stops, targets and lots with it.
11 min read
Read more →Build on this article with the full gold trading curriculum, ordered from the basics to advanced topics, free.
