
Tools
Trailing Drawdown: End-of-Day vs Intraday, With Numbers
Trailing drawdown is a loss limit that rises with your best balance. See how end-of-day and intraday trailing differ, with worked numbers on a $50,000 account.
10 min read
Read more →
What is drawdown in trading? It is the fall from an account's peak to its next low. Learn to measure it and why a 50% loss needs a 100% gain to recover.
If you are asking what is drawdown in trading, the short answer is the distance your account has fallen from its highest point. It tells you how much you have lost since your best moment, and it is the number that decides whether you keep trading.
This guide shows how to measure it, what max drawdown means and why recovery is lopsided. A 50% loss needs a 100% gain to get back to even. Every figure uses the site's shared $2,400 account, and none of it is advice to place any trade.
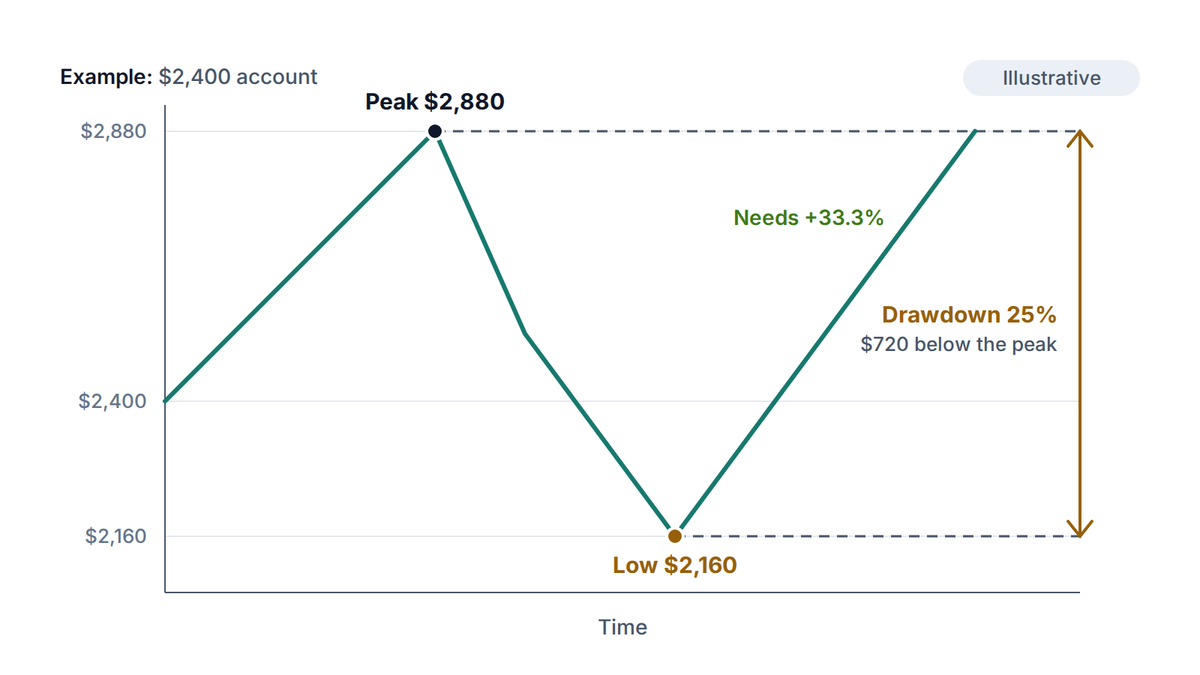
Drawdown is the decline in your account value from a peak to a later low, before a new peak is made. If your account reached $2,880 and then fell to $2,160, it is in a drawdown of $720. The word describes the fall, the recovery from it and the whole spell in between.
The drawdown meaning in trading is easy to mix up with a loss on one trade. They are different things. A single trade loses a set amount, while drawdown adds up the damage across many trades, including winners that gave back their gains. You can be in a deep drawdown without having made a single large loss.
What each variable means:
Two words matter here. Equity (balance plus or minus the running profit or loss on open trades) is what you should measure, because a floating loss is part of the fall even before you close the trade. Peak is the highest equity or balance before the fall began.
Both versions are useful. The dollar figure shows what a bad run costs you. The percentage lets you compare accounts and strategies of different sizes, and it is the number that sets how hard recovery is.
| Item | Value |
|---|---|
| Starting balance | $2,400 |
| Peak after a good run (+20%) | $2,880 |
| Low after a bad run | $2,160 |
| Drawdown in dollars | $720 |
| Drawdown in percent | 25% of the peak |
| Gain needed to reach the peak again | 33.3% from the low |
Measuring drawdown takes three steps. You do not need special software, because a spreadsheet of your account value after each trade or each day is enough. Most trading platforms and statements also report it for you.
Use the same period every time. A month, a quarter and a year give different answers, and a longer period can only make max drawdown larger or the same. A strategy that looks calm over three months may have a far harsher record over three years.
People searching for what is max drawdown in trading want one number for the worst case so far. It is the biggest peak-to-trough fall in your history, and it is reported as a percentage of that peak. If your max drawdown is 25%, then at your worst point you were down a quarter from your best.
It has limits. Max drawdown only shows the past, so a future run can be worse than anything on record. It also says nothing about how long the dip lasted, which is why many traders track the time to recovery as well. A 15% drawdown that takes a year to climb out of is a different experience from one that clears in a month.
| Term | What it means |
|---|---|
| Drawdown | The fall from a peak to a later low, in dollars or percent |
| Current drawdown | How far below the peak the account is right now |
| Max drawdown | The largest peak-to-trough fall over the period measured |
| Recovery time | How long the account takes to return to the previous peak |
Measure equity, not just closed trades
A statement built from closed trades hides the dips that happened while a trade was open. If you can, track equity as well, because a position that went deep into the red and then recovered still put you through that drawdown.
Here is the part that surprises most new traders. Losses and gains are percentages of different amounts. A loss is taken from your peak, but the gain that repairs it is taken from the smaller balance you have left.
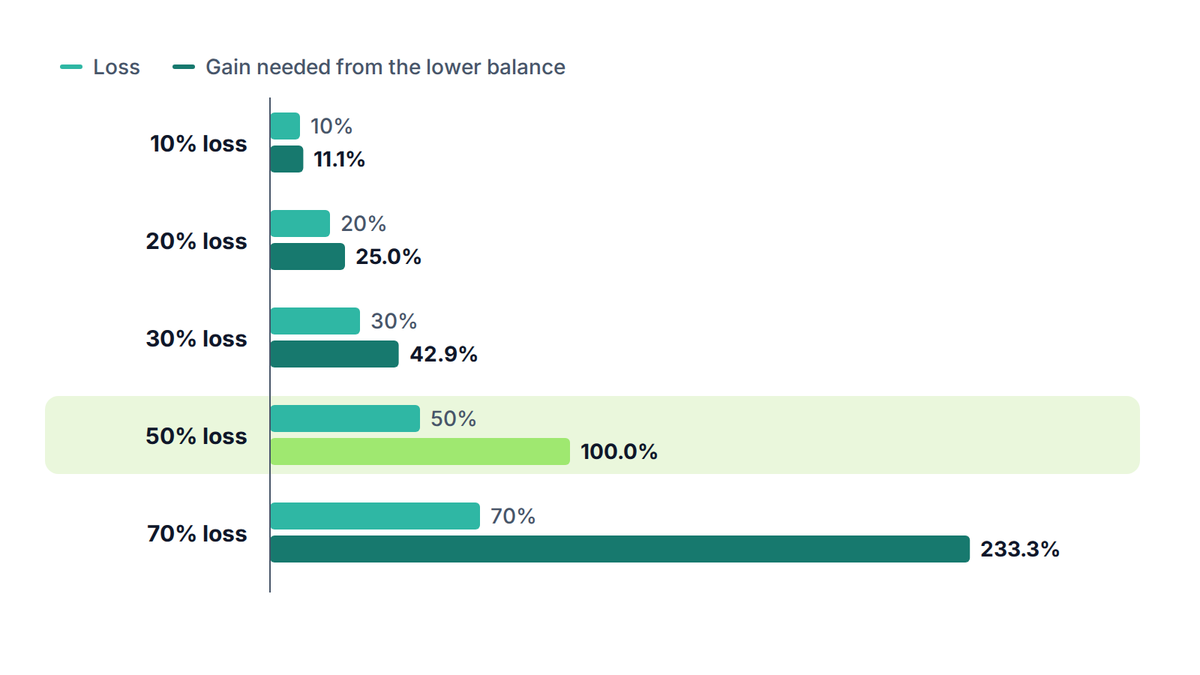
Take the $2,400 account and lose half of it. You now have $1,200. To get back to $2,400 you must add $1,200, and $1,200 is 100% of what you hold now. A 10% gain on $1,200 only adds $120, so you would need a very long run of good trades.
What each variable means:
Put in 0.50 and you get 1 ÷ 0.5 − 1 = 1, which is 100%. The same formula gives every row below. The numbers come from the site's drawdown calculator, which reports the recovery gain for any loss streak you enter.
| Drawdown | Account value from $2,400 | Gain needed to recover |
|---|---|---|
| 10% | $2,160 | 11.1% |
| 20% | $1,920 | 25.0% |
| 30% | $1,680 | 42.9% |
| 40% | $1,440 | 66.7% |
| 50% | $1,200 | 100.0% |
| 60% | $960 | 150.0% |
| 70% | $720 | 233.3% |
| 80% | $480 | 400.0% |
| 90% | $240 | 900.0% |
Look at how the right-hand column behaves. Up to about a 20% drawdown, the gain you need stays close to the loss. Past 30% it grows faster than the loss does, and past 50% it runs away. A 90% loss needs a ninefold gain, which is why a deep hole is so hard to leave.
It works the other way too
The same arithmetic explains why a small loss is cheap to repair. A 5% drawdown needs a 5.3% gain. Keeping losses small is not about caution for its own sake. It keeps the repair job short.
Drawdown does not usually arrive in one blow. It builds from a streak of losses, each one taken from a smaller balance than the last. Because each loss is a percentage of what is left, the account falls a little less each time, but it still falls.
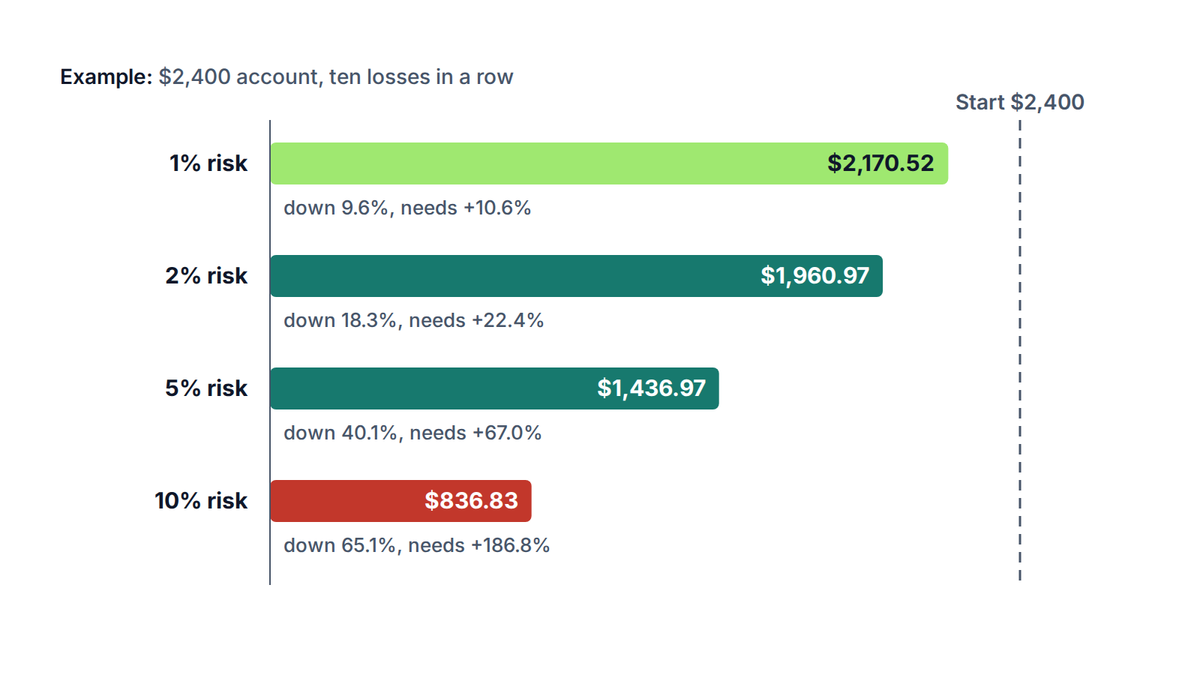
The risk you take per trade sets how fast it falls. The table assumes ten losses in a row on a $2,400 account, each losing a fixed percentage of the balance at that moment. The figures come from the drawdown calculator.
| Risk per trade | Balance after 10 losses | Drawdown | Gain needed to recover |
|---|---|---|---|
| 1% | $2,170.52 | 9.6% | 10.6% |
| 2% | $1,960.97 | 18.3% | 22.4% |
| 5% | $1,436.97 | 40.1% | 67.0% |
| 10% | $836.83 | 65.1% | 186.8% |
At 1% risk, ten losses in a row leave you down 9.6%. That is annoying but recoverable with a few good weeks. At 10% risk the same streak takes away almost two thirds of the account, and you would need to nearly triple what is left. The strategy is identical. Only the size changed.
Ten losses in a row can look rare, but a long run of trades makes streaks likely even for a method that wins more often than it loses. A method that wins 50% of the time will meet a run of five losses fairly often. The risk of ruin calculator helps you see how win rate, ratio and risk per trade combine. You can also read how the risk-reward ratio shapes the length of those runs.
Plan for the streak before it happens. If a run of ten losses at your chosen risk would break your plan, the risk is too high. The guide to sizing a gold position shows how to turn a risk percentage into a lot size from your stop.
There is no single right limit. What matters is what you can live with, both financially and emotionally. Many traders set a maximum they will accept and a rule for what to do when they reach it, such as cutting size or pausing to review.
These bands are rules of thumb, not standards. A trader with a small account who is learning may accept a smaller limit than a funded professional. Prop firm evaluations often set their own drawdown limits as part of their rules, so read them closely if you try one. The lesson on drawdown and what it does to an account goes deeper on setting a limit.
Chasing the loss makes it worse
Doubling your size to recover faster means a second bad streak digs the hole much deeper. The asymmetry cuts hardest when you are already down. The most reliable way back is steady, smaller trades.
Leverage matters here too. A large position on a small account can turn a normal move into a margin problem long before a drawdown limit is reached. The guide to what a margin call is covers that side of it.
Try it now
Enter your balance, the number of losing trades in a row and the loss per trade. The calculator returns the ending balance, the total drawdown and the gain you would need to recover, so you can test your own risk setting before you trade it.
Drawdown is the fall in an account's value from its highest point to a later low. It is shown as a dollar amount or as a percentage of the peak. It stays in force until the account makes a new high.
Max drawdown is the largest peak-to-trough fall over the period you measure. If an account peaked at $2,880 and later bottomed at $2,160, the max drawdown is 25%, provided no fall in the period was bigger.
Because the gain is applied to a smaller balance. After a 50% loss on $2,400 you hold $1,200. You need to add $1,200 to get back to $2,400, and that is 100% of the $1,200 you have left.
Risk a small, fixed percentage of your account per trade, always use a stop loss and avoid stacking several positions that move together. Cutting size during a losing streak also helps. No method removes drawdown entirely.
The PipsMorrow Team
A team of writers covering XAU/USD gold trading education. We focus on explaining the mechanics and risk management in a structured way, with no trade signals and no promotion of any specific broker.
Last updated
Trailing drawdown is a loss limit that rises with your best balance. See how end-of-day and intraday trailing differ, with worked numbers on a $50,000 account.
10 min read
Read more →Compounding trading means each period's gain is added to the balance that earns the next. See the math on a $2,400 account, and the risks it leaves out.
9 min read
Read more →How to size a position on gold to the risk you can afford: a five-step routine, worked numbers on a $2,400 account and the traps that turn 1% into 10%.
8 min read
Read more →Build on this article with the full gold trading curriculum, ordered from the basics to advanced topics, free.

