
Tools
Trading Expectancy: Why Win Rate Alone Misleads
Trading expectancy is what a strategy earns per trade on average. See how a 35% win rate can pay while a 70% win rate loses, with worked examples in R.
11 min read
Read more →
The risk-reward ratio tells you what a trade pays, not whether it works. Learn the break-even win rate, expectancy in R and how the spread shifts both.
A 1:2 risk-reward ratio sounds like a good deal: risk $1 to make $2. But the ratio only describes what a trade pays when it works. It says nothing about how often that happens, and that is the half most beginners skip.
This article shows how the risk-reward ratio and the win rate fit together. You get the break-even formula, the expectancy formula, a gold example with the spread included, and a short list of mistakes to avoid. Every figure uses the site's shared $2,400 account with 1% risk per trade.
The risk-reward ratio (also written risk to reward ratio, or just risk reward) compares two distances on a chart. Risk is the distance from your entry to your stop loss, the price where the idea is proven wrong. Reward is the distance from your entry to your target.
A ratio of 1:2 means the reward is two times the risk. If you risk $24 on a trade, a winner pays $48 and a loser costs $24. A 1:1 ratio pays $24 on a $24 risk, and a 1:3 ratio pays $72.
What each variable means:
Traders often call the amount at risk 1R. A trade that reaches a 1:2 target makes +2R, and a trade stopped out loses −1R. Counting in R lets you compare trades of different sizes. The lesson on risk-reward and thinking in R covers the habit in more depth.
Notice what is missing. The ratio is set by where you put two lines on a chart. It does not tell you how likely price is to reach each one. That probability is the win rate, and the two numbers only make sense together.
Imagine two traders who both use a 1:2 ratio. One wins 20% of the time and the other wins 45%. The first slowly loses money and the second slowly makes it. The ratio is identical, so it cannot be what separates them.
Over many trades, wins and losses have to cancel for you to break even. Each win pays R times the risk, and each loss costs one risk. That gives a simple break-even point.
What each variable means:
| Risk-reward ratio | Win pays | Loss costs | Break-even win rate |
|---|---|---|---|
| 1:1 | +1R ($24) | −1R ($24) | 50.0% |
| 1:1.5 | +1.5R ($36) | −1R ($24) | 40.0% |
| 1:2 | +2R ($48) | −1R ($24) | 33.3% |
| 1:3 | +3R ($72) | −1R ($24) | 25.0% |
| 1:4 | +4R ($96) | −1R ($24) | 20.0% |
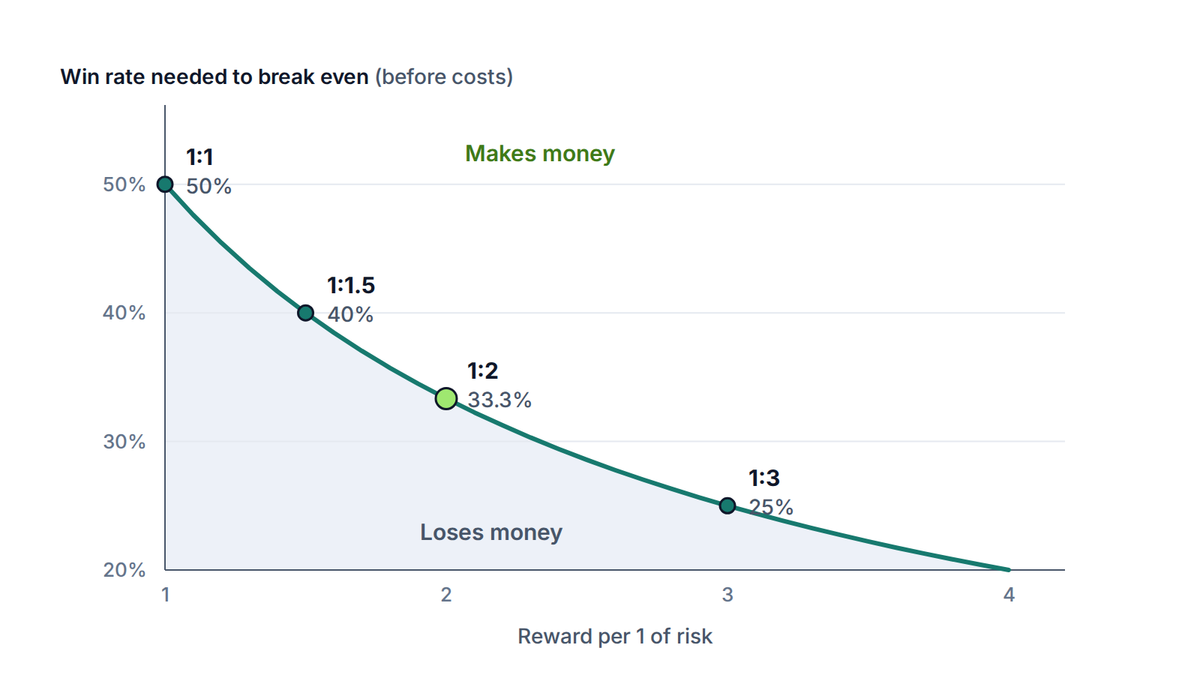
Read the 1:2 row carefully. You can lose twice for every win and still come out level. But you need to win at least one trade in three, every time the sample is large enough, and not only on good weeks.
The break-even rate tells you the line. Expectancy tells you how far above or below it you are. It is the average result per trade, measured in R, once you account for both the win rate and the payout.
What each variable means:
Take a 1:2 method that wins 40% of its trades. Expectancy is 0.40 × 2 − 0.60 = +0.20R. On a $24 risk, that is $4.80 per trade on average. Over 100 trades you would expect 40 winners worth $1,920 and 60 losers costing $1,440, a net $480.
| Method | Win rate | Expectancy | Average per trade at $24 risk | Over 100 trades |
|---|---|---|---|---|
| 1:2 | 30% | −0.10R | −$2.40 | −$240 |
| 1:2 | 40% | +0.20R | +$4.80 | +$480 |
| 1:1 | 60% | +0.20R | +$4.80 | +$480 |
| 1:3 | 20% | −0.20R | −$4.80 | −$480 |
| 1:3 | 25% | 0.00R | $0.00 | $0 |
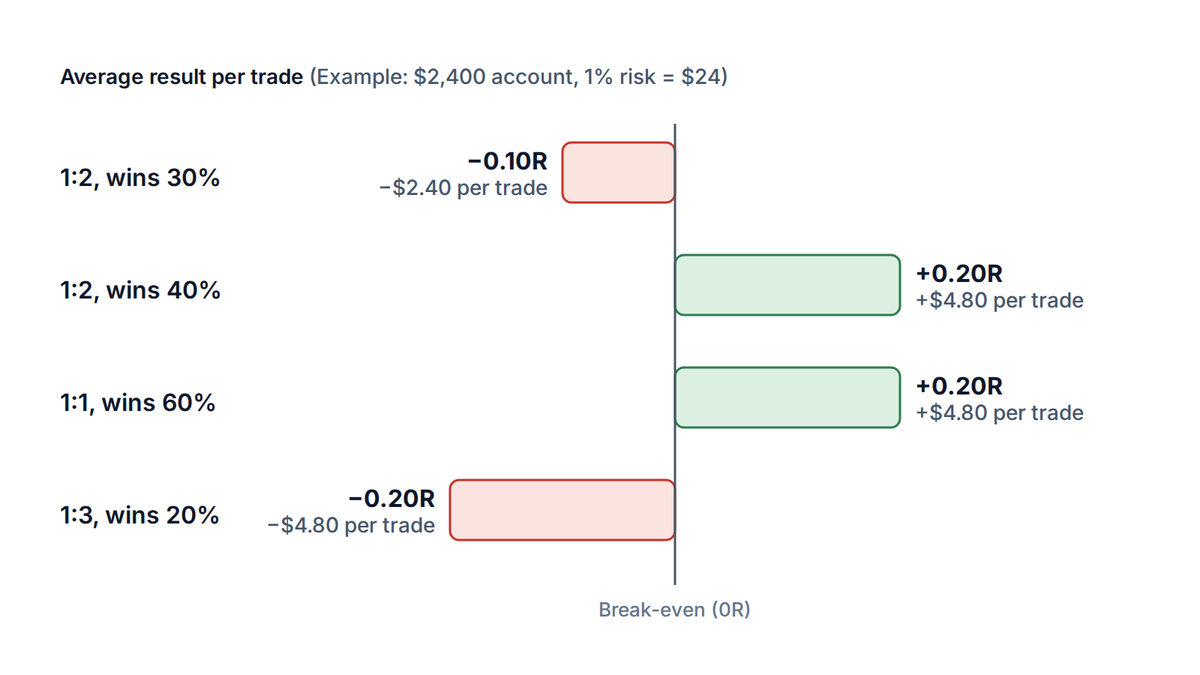
Look at the third row. A 1:1 method that wins 60% of the time has the same expectancy as a 1:2 method that wins 40%. The first feels comfortable, with more green trades. The second feels harder, with more losses in a row. Neither is better in the long run.
You can test a method's numbers on past trades with the profit and loss calculator. The lesson on expectancy goes further into what a positive number does and does not promise.
It is tempting to see the table and conclude that 1:4 is better than 1:2, because you need to win only 20% of the time. The catch is that the win rate is not a dial you set. Price has to travel twice as far to reach a 1:4 target as a 1:2 target, and that happens less often.
Picture the same entry and the same stop, with the target moved further away. Every trade that would have reached the nearer target but turned around before the further one becomes a loss. The win rate falls, and it can fall faster than the break-even line does.
| Target moved to | Break-even win rate | If the real win rate drops to | Result |
|---|---|---|---|
| 1:2 | 33.3% | 38% | +0.14R per trade |
| 1:3 | 25.0% | 27% | +0.08R per trade |
| 1:4 | 20.0% | 17% | −0.15R per trade |
The numbers above are not a law of markets. They show a possible pattern: a wider target moves the break-even line down and the real win rate down with it. Whether you end up ahead depends on which falls faster, and only your own trade records can answer that.
How to find your real win rate
Log every trade for at least 50 to 100 trades with its result in R. Count the winners and divide by the total. Anything fewer is mostly noise: a method with a true 40% win rate can easily show 30% or 50% over 20 trades.
The ratio you draw on a chart is not quite the ratio you trade. A spread (the gap between the buy price and the sell price) is a cost you pay on entry. It widens your stop and shortens your target at the same time.
Say you plan a buy on gold (XAU/USD) with a stop $3.00 below the entry and a target $6.00 above it. That looks like 1:2. With a 30-cent spread, you buy at the higher ask price but your stop and target trigger off the lower bid price. The real stop is $3.30 away and the real target is $5.70 away.
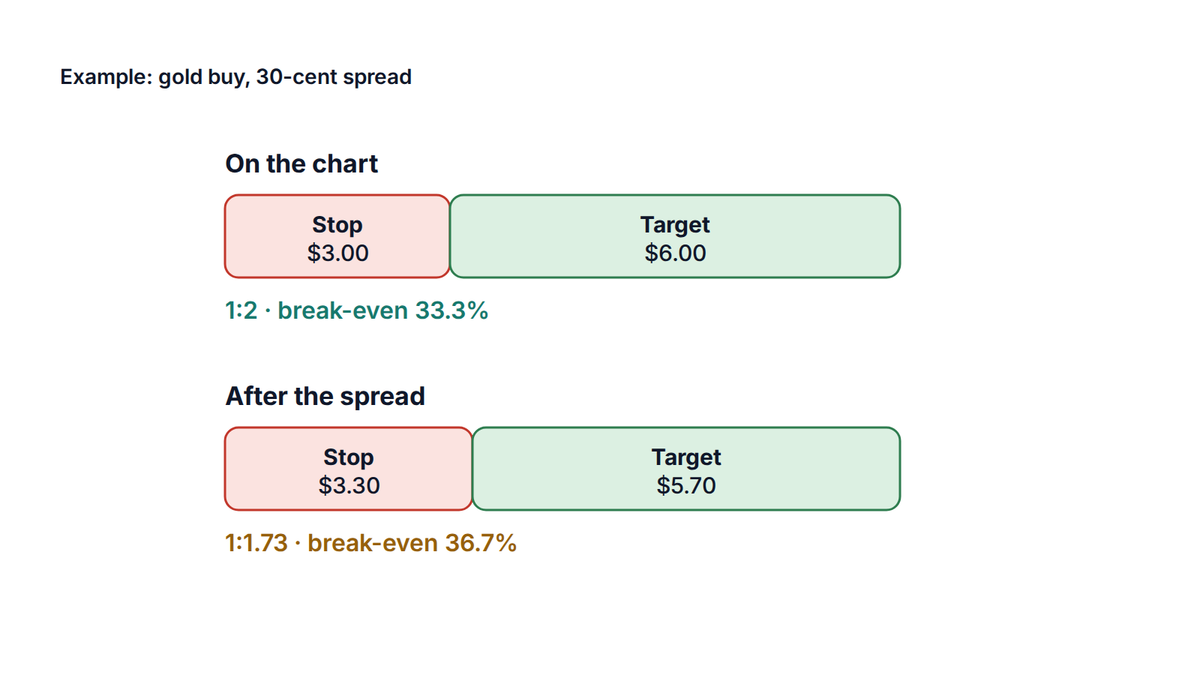
The lot size follows the real stop. At $3.30, which is 330 pips on a $0.01 pip, a $24 risk gives 0.07 lots after rounding down. A stop hit costs $23.10 and the target pays $39.90. The ratio is 39.90 ÷ 23.10, or 1:1.73.
| Version | Stop | Target | Ratio | Break-even win rate |
|---|---|---|---|---|
| Drawn on the chart | $3.00 | $6.00 | 1:2 | 33.3% |
| After a $0.30 spread | $3.30 | $5.70 | 1:1.73 | 36.7% |
The break-even rate rises by more than three points. If your method wins 40%, expectancy drops from +0.20R to about +0.09R, roughly $2.10 per trade on a $23.10 risk. A method that looked comfortably positive on the chart is now only slightly so.
The effect is larger on short-term trades, where the stop and target are small next to the spread. For the full sizing routine, see how to size a position on gold, and use the lot size calculator to turn the real stop into lots.
Try it now
Enter your balance, risk percentage and the real stop, spread included, to get the lot size. Then use the profit and loss calculator to check what the target pays at that size.
A losing streak still hurts, even when the method is sound. Five losses at 1% risk take a $2,400 account to about $2,282, a drawdown of roughly 4.9%. The drawdown calculator shows what a longer run does, and the risk of ruin calculator links win rate, ratio and risk per trade.
No ratio protects you from gaps
A stop loss limits the loss in normal conditions only. Around major data releases or over a weekend, price can jump past a stop and fill at a worse level. A planned 1:2 trade can then lose more than 1R, which pushes the real ratio and the break-even rate in the wrong direction.
There is no good ratio on its own. A ratio is good when your real win rate is above its break-even rate by enough to cover costs. A 1:2 ratio needs more than 33.3%, and a 1:1 ratio needs more than 50%.
You need to win at least 33.3% of trades to break even, before the spread and commissions. After costs the figure is higher, as the gold example shows: 36.7% once a 30-cent spread is included.
Yes, people use the phrases interchangeably. Both compare the distance to your stop with the distance to your target. They are different from risk per trade, which is the share of your account you lose if the stop is hit.
Yes, if you win more than half of your trades after costs. A 1:1 method that wins 60% has an expectancy of +0.20R. Whether you can reach that rate on your chosen market is a question your trade records have to answer.
Divide the distance from entry to target by the distance from entry to stop. A $3.00 stop and a $6.00 target give 6 ÷ 3 = 2, written 1:2. Use the real distances, with the spread included, for the most honest figure.
The PipsMorrow Team
A team of writers covering XAU/USD gold trading education. We focus on explaining the mechanics and risk management in a structured way, with no trade signals and no promotion of any specific broker.
Last updated
Trading expectancy is what a strategy earns per trade on average. See how a 35% win rate can pay while a 70% win rate loses, with worked examples in R.
11 min read
Read more →How to size a position on gold to the risk you can afford: a five-step routine, worked numbers on a $2,400 account and the traps that turn 1% into 10%.
8 min read
Read more →Reversal candlestick patterns only mean something in the right place. Learn the few that matter, the context each needs, and how to set a stop and size.
8 min read
Read more →Build on this article with the full gold trading curriculum, ordered from the basics to advanced topics, free.

