
Tools
Risk-Reward Ratio: Why 1:2 Needs a Win Rate
The risk-reward ratio tells you what a trade pays, not whether it works. Learn the break-even win rate, expectancy in R and how the spread shifts both.
10 min read
Read more →
Trading expectancy is what a strategy earns per trade on average. See how a 35% win rate can pay while a 70% win rate loses, with worked examples in R.
Most new traders judge a strategy by one number: how often it wins. It feels natural, because winning is what you want. But trading expectancy, the average amount a strategy makes or loses per trade, can be positive with a win rate of 35% and negative with a win rate of 70%.
This article shows how to calculate expectancy in R (one R is the amount you risk per trade), why win rate and payout must be read together, and how costs and sample size change the answer. Every example uses the site's shared $2,400 account with 1% risk, so 1R is $24.
Trading expectancy answers a simple question: if you placed this trade again and again, what would you make on average each time? It is the long-run average, not a prediction for the next trade. Any single trade is still a win or a loss.
Expectancy needs three inputs. The first is the win rate, the share of trades that finish in profit. The second is the average win, and the third is the average loss, both measured in R. Measuring in R means a $48 win on a $24 risk is +2R, whatever the account size.
What each variable means:
Multiply the result by your dollars per R to get money. An expectancy of +0.225R on a $24 risk is $5.40 per trade. The lesson on expectancy and what your edge is worth covers the same idea at a slower pace.
If you have read about the risk-reward ratio, this is the same formula in a wider form. That article fixes the payout at a planned target. Here, the average win and average loss come from what your trades actually did, which is closer to real life.
Meet two traders who each risk $24 per trade on a $2,400 account. Trader A wins 70% of the time but tends to close winners early, so the average win is only 0.4R. Trader B wins just 35% of the time but lets winners run to an average of 2.5R. Both lose about 1R when wrong.
| Trader A | Trader B | |
|---|---|---|
| Win rate | 70% | 35% |
| Average win | +0.4R ($9.60) | +2.5R ($60) |
| Average loss | −1R ($24) | −1R ($24) |
| Expectancy | 0.70 × 0.4 − 0.30 × 1 = −0.02R | 0.35 × 2.5 − 0.65 × 1 = +0.225R |
| Average per trade | −$0.48 | +$5.40 |
| Over 100 trades | −$48 | +$540 |
Trader A feels successful. Seven winners out of ten is a pleasant day-to-day experience. But the 70 small wins add up to $672, while the 30 losses cost $720, so the account slowly shrinks. Trader B sees six or seven losses in every ten trades, yet the 35 big wins bring in $2,100 against $1,560 of losses.
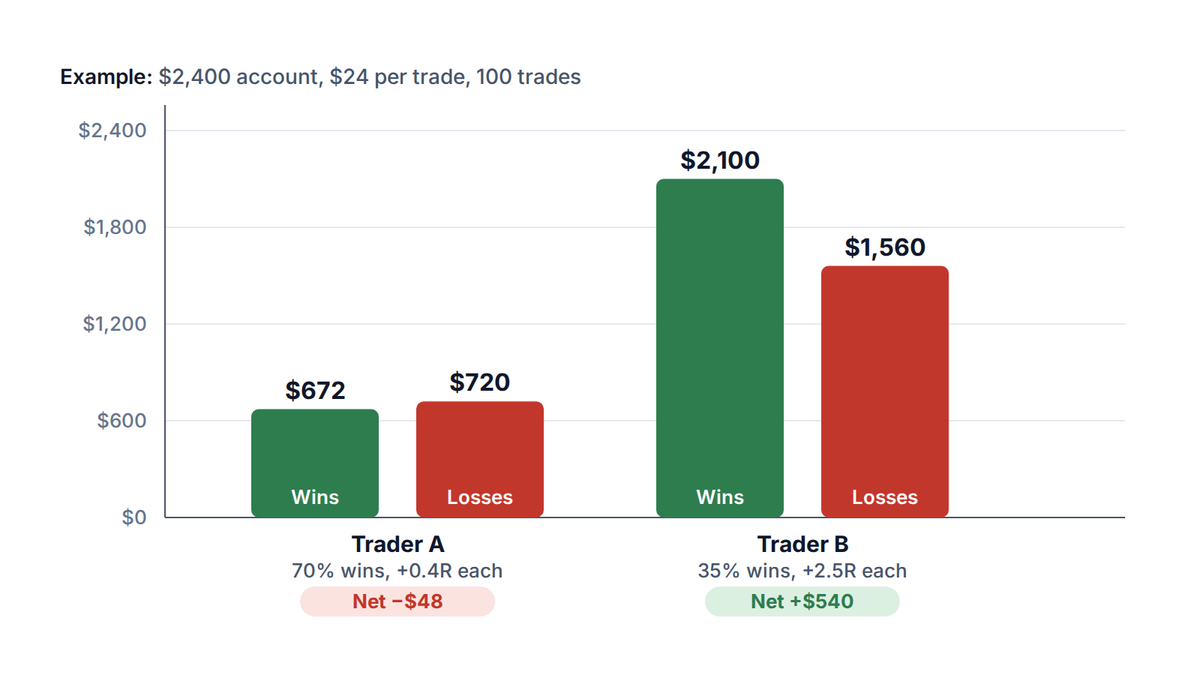
Neither trader is better at predicting direction. Trader B simply gets paid more when right. That is why a win rate quoted alone, in an advert or a forum post, tells you very little.
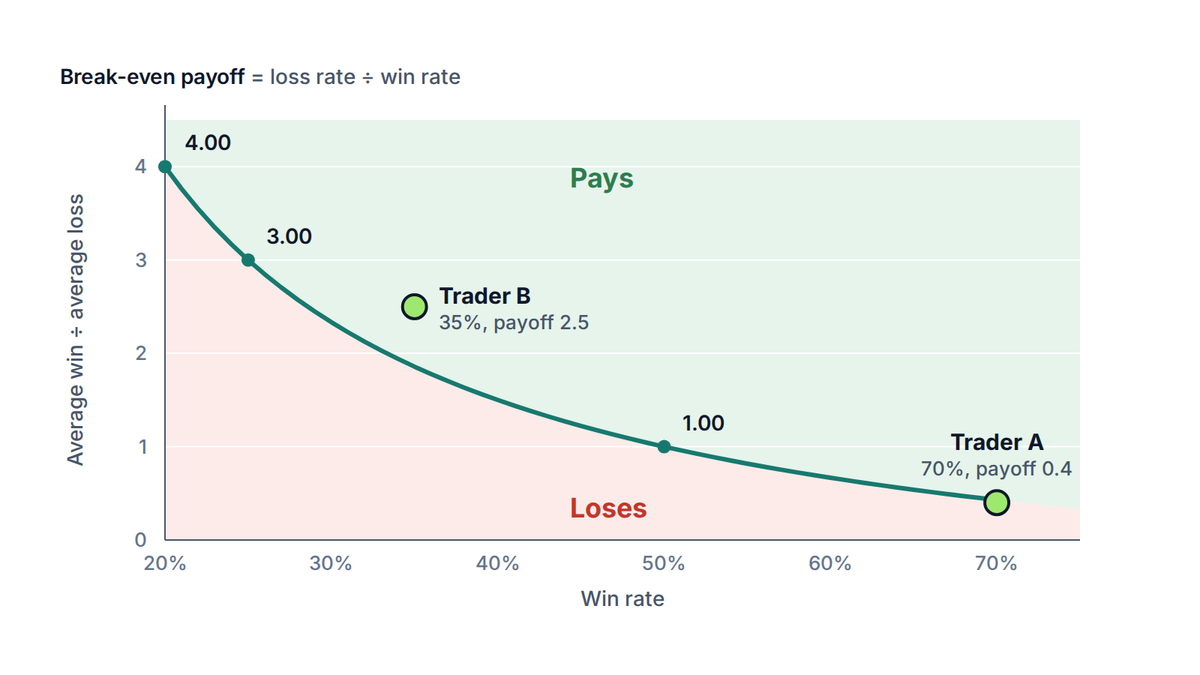
Flip the formula around and you get a useful rule. For a given win rate, there is a break-even payoff: the average win, in multiples of the average loss, at which expectancy is exactly zero. Anything above it pays, and anything below it loses.
What each variable means:
| Win rate | Break-even payoff | What it means |
|---|---|---|
| 70% | 0.43 | Wins can be less than half a loss |
| 50% | 1.00 | Wins must equal losses |
| 35% | 1.86 | Wins must be almost twice a loss |
| 25% | 3.00 | Wins must be three times a loss |
| 20% | 4.00 | Wins must be four times a loss |
Trader A needed only 0.43 at a 70% win rate, so a payoff of 0.4 falls just short. Trader B needed 1.86 at 35% and delivers 2.5, comfortably above the line. The same table also shows why chasing a very low win rate with a huge target is risky: you must be right about how far price travels, not just which way.
Profit factor tells the same story
Profit factor is total gross wins divided by total gross losses. Trader A's is 672 ÷ 720 = 0.93 and Trader B's is 2,100 ÷ 1,560 = 1.35. Anything below 1.0 means the strategy loses money. It is the same information as expectancy, packaged as a ratio of dollars.
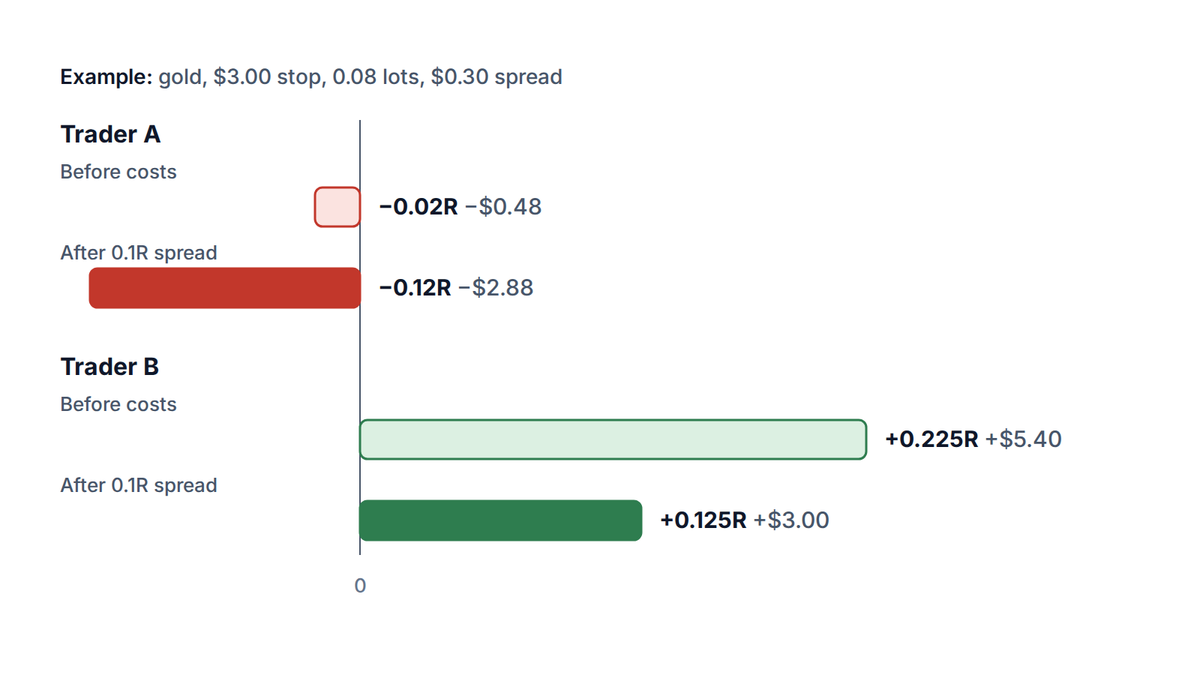
Expectancy is only honest when it is measured after costs. The main cost on a short-term gold trade is the spread (the gap between the buy price and the sell price). You pay it on every trade, win or lose, so it subtracts from expectancy as a flat amount.
Say you trade gold (XAU/USD) with a $3.00 stop. At $24 risk and 100 troy ounces per lot (a lot is a standard trade size, and a troy ounce is about 31.1 g), the position is 0.08 lots. A $0.30 spread costs 0.08 × 100 × $0.30 = $2.40, which is 0.1R on every trade.
| Trader A | Trader B | |
|---|---|---|
| Expectancy before costs | −0.02R | +0.225R |
| Spread cost per trade | −0.10R | −0.10R |
| Expectancy after costs | −0.12R (−$2.88) | +0.125R (+$3.00) |
| Over 100 trades | −$288 | +$300 |
Trader B keeps most of the edge, but it fell from $5.40 to $3.00 per trade. A trader with a thinner edge, say +0.08R, would be pushed below zero by the same spread. This is why strategies that trade often and aim for small moves are the most sensitive to costs. The what is the spread in forex guide explains how brokers set it.
Your journal gives you an expectancy figure, but it is an estimate. Each trade is a win of 2.5R or a loss of 1R, so single results swing widely around the average. The fewer trades you have, the wider the band of values your true expectancy could sit in.
For Trader B's numbers, one trade has a standard deviation (a measure of spread around the average) of about 1.67R. The average of n trades has an uncertainty of 1.67 ÷ √n. A rough 95% range is the average plus or minus twice that.
| Trades logged | Uncertainty (± 2 standard errors) | Rough range for a true +0.225R |
|---|---|---|
| 50 | ± 0.47R | −0.25R to +0.70R |
| 100 | ± 0.33R | −0.11R to +0.56R |
| 200 | ± 0.24R | −0.01R to +0.46R |
| 400 | ± 0.17R | +0.06R to +0.39R |
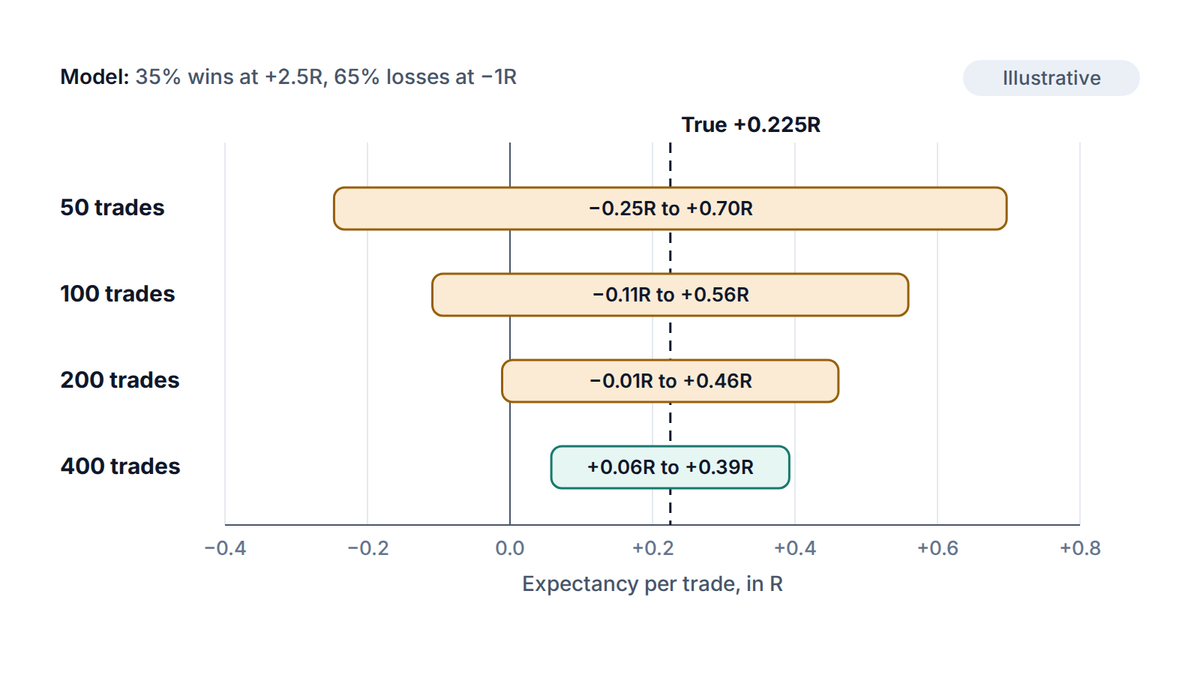
The practical rule: treat the first 50 trades as a pilot, not a verdict. A positive result is a reason to keep going, and a negative one is a reason to look closer. It is not proof either way. Keep logging in the same format with a trading journal template so the numbers stay comparable.
Long losing runs are part of the maths too. For a method that loses 65% of the time, 10 losses in a row has a probability of just 1.3% on any given 10 trades. Across 100 trades, though, a run of at least 6 losses is nearly certain (about 96%), and a run of 8 or more is more likely than not (about 69%).
Positive expectancy does not protect you from drawdown (the fall from an account's peak to a later low). At 1% risk, eight losses in a row take a $2,400 account to about $2,214.59, a fall of roughly 7.7%. That is normal for Trader B and still hard to sit through.
The risk of ruin calculator runs this as a simulation. Entering a 35% win rate, 2.5R wins, 1R losses and 1% risk over 200 trades, it shows about an 11.5% chance of a 20% fall from a peak and a 1.9% chance of the account dropping 20% below its start. Those are simulated estimates and not forecasts, but they put the pain in proportion.
Drawdowns are also where discipline breaks. A trader with a real edge who abandons it after seven losses has thrown away the thing that made it work. The article on revenge trading covers what happens next, and the drawdown guide covers the recovery maths.
Try it now
Enter your win rate, average win, average loss and risk per trade to see the expectancy and how often a deep drawdown appears. Use the profit and loss calculator to check what a single trade pays at your lot size.
If your results come from a backtest (a test of rules on past price data), be careful. Tests tend to flatter a strategy because rules get tuned to the past. The piece on backtesting trading strategies explains how to keep the figure honest.
Expectancy is not a guarantee
A positive past expectancy describes what a method did, not what it must do. Markets change, and an edge can fade. Gaps over weekends or around data releases can also turn a planned 1R loss into a larger one, which pulls the average loss, and so the expectancy, the wrong way.
Trading expectancy is the average amount a strategy makes or loses per trade over many trades, usually measured in R. It combines the win rate, the average win and the average loss into one number. A positive figure means the method pays on average, before any doubt about sample size.
Any figure above zero after costs is positive, but a thin one is fragile. An expectancy of +0.1R can vanish with a slightly wider spread or a small change in win rate. Many traders look for a margin that survives a pessimistic test, rather than aiming for a specific number.
Yes. If the average win is large enough compared with the average loss, a low win rate pays. At a 35% win rate, wins must average at least 1.86 times the average loss to break even, and a payoff of 2.5 gives +0.225R per trade.
Win rate counts how often trades finish in profit. Expectancy also weighs how much those wins and losses are worth. Two strategies can share a win rate and have opposite expectancy, which is why win rate on its own cannot tell you whether a method works.
There is no fixed number, but 50 trades is too few to rely on. In the simple model used above, a real +0.225R edge needed about 220 trades before the rough 95% range stayed above zero. Real results are noisier, so more is better.
The PipsMorrow Team
A team of writers covering XAU/USD gold trading education. We focus on explaining the mechanics and risk management in a structured way, with no trade signals and no promotion of any specific broker.
Last updated
The risk-reward ratio tells you what a trade pays, not whether it works. Learn the break-even win rate, expectancy in R and how the spread shifts both.
10 min read
Read more →Gold price vs interest rates: why the real yield, not the headline rate, drives gold, where that link broke after 2022, and how to size trades around it.
10 min read
Read more →FOMC and gold explained: why the rate decision is rarely the news, when it lands in New York time and UTC, and how to size a gold trade around it.
12 min read
Read more →Build on this article with the full gold trading curriculum, ordered from the basics to advanced topics, free.

