
Gold
Gold Price vs Interest Rates: Why Real Yields Matter More
Gold price vs interest rates: why the real yield, not the headline rate, drives gold, where that link broke after 2022, and how to size trades around it.
10 min read
Read more →
Use this trading journal template with 12 columns, a ten-trade sample and formulas for Google Sheets or Notion, so you can track R, rule breaks and edge.
A trading journal template is a table with one row per trade and a fixed set of columns. Most journals fail for one reason: they ask for too much, so you stop filling them in. This one has twelve columns, and each earns its place by answering a question you will ask in a weekly review.
Below you get the columns, a ten-trade sample on a $2,400 account, and the formulas to build a free trading journal in Google Sheets or Notion in about twenty minutes. There is no file to download here. Copy the layout and the formulas into your own sheet. This is education, not a signal to place any trade.
A trading journal is a written record of every trade you take, with enough detail to review it later. Your account statement shows what happened. A journal also shows why you did it, and that is the part you cannot rebuild from memory a month later.
A good journal answers three questions. Which setups make money for you? Do you follow your own rules? And when do your worst trades happen? You cannot answer any of them from the profit and loss line alone.
The common mistake is building a journal that records everything. Twenty columns, a screenshot for every trade and a paragraph of reflection look thorough on day one. By week three the habit is gone. The lesson on keeping a journal worth reading makes the same point: a short journal you use beats a perfect one you abandon.
The columns below fall into four groups. Two groups are filled in before you enter, one when you close, and one in the review. Keeping them in this order also keeps the sheet honest, because the plan is written down before the result is known.
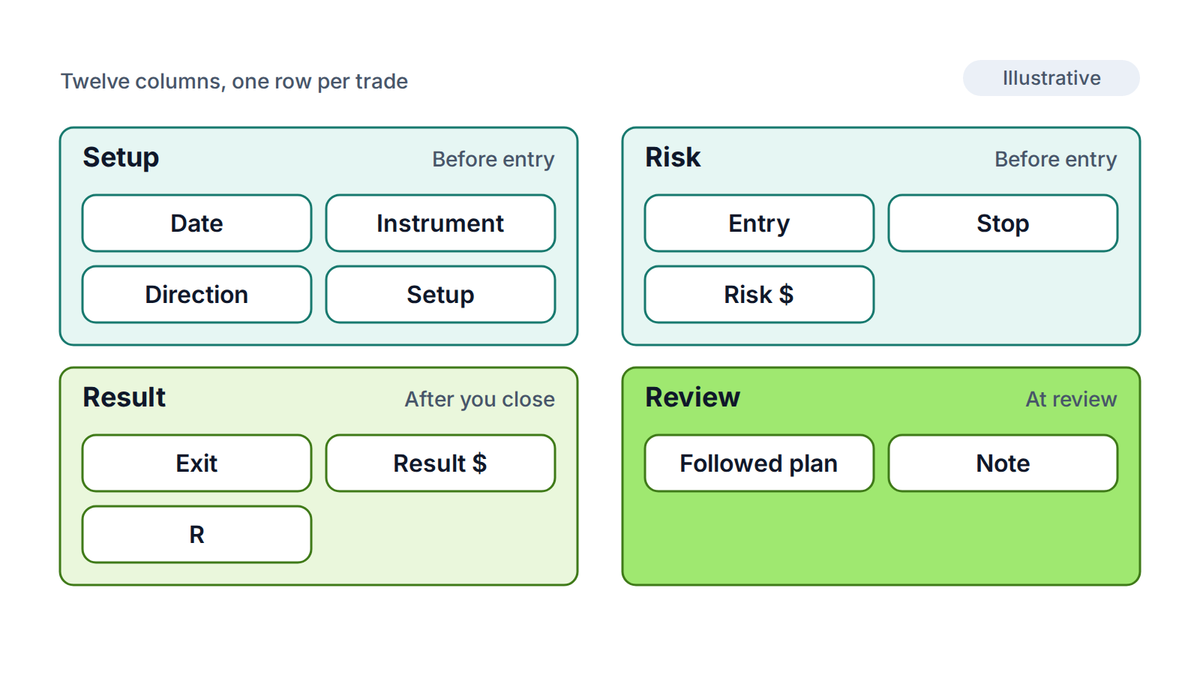
| Column | What you enter | Why it earns its place |
|---|---|---|
| 1. Date | Open date and time, in New York time | Shows which sessions and weekdays you trade best |
| 2. Instrument | The pair or metal, such as EUR/USD or XAU/USD | Splits results by market |
| 3. Direction | Buy or sell | Reveals a bias toward one side |
| 4. Setup | One tag from your plan, such as Breakout or Pullback | The most useful column: it shows which setups pay |
| 5. Entry | Fill price | Needed to check slippage and the stop distance |
| 6. Stop | Stop loss price, set before entry | Fixes the risk and proves you had a plan |
| 7. Risk ($) | Money lost if the stop is hit | The base for R; should be the same every trade |
| 8. Exit | Closing price | Shows whether you exit early or late |
| 9. Result ($) | Profit or loss after costs | The number your account actually moved |
| 10. R | Result divided by Risk | Compares trades of different size on one scale |
| 11. Followed plan | Yes or No | Separates a bad trade from a bad outcome |
| 12. Note | One line: what you felt, what you would change | Turns a record into a lesson |
Two columns do most of the work and are the first to be dropped. Setup lets you group trades later, and without it you only have one long list. Followed plan is a plain Yes or No, and it is the column that tells a losing trade done right from a losing trade done badly.
A trade can follow every rule and still lose. Another can break three rules and win. If you only look at the outcome, you will start repeating the second kind. The Yes or No column stops that.
R is the money you risk on a trade. If you risk $24 and make $43.20, that is 1.8R. If you lose the full $24, that is -1R. Because every trade is measured against its own risk, a win on a small position and a win on a large one can be added up fairly.
It also keeps the journal useful if your account grows. Dollar results change as your size changes, but R stays comparable. The article on the risk-reward ratio covers R in more depth.
Keep risk the same
The Risk ($) column only works if you size each trade from the stop distance. See how to size a position for the steps, or use the lot size calculator.
Here is what ten entries look like on the site's shared example: a $2,400 account risking 1% per trade, so Risk ($) is $24 on every row. A gold trade with a $3.00 stop, for example, sizes to 0.07 lots (a lot is a standard trade size; 1 standard lot is 100,000 units of a currency or 100 troy ounces of gold). The table shows four of the twelve columns to stay readable.
| Trade | Setup | Result ($) | R | Followed plan |
|---|---|---|---|---|
| 1 | Breakout | 43.20 | +1.8 | Yes |
| 2 | Pullback | -24.00 | -1.0 | Yes |
| 3 | Breakout | -24.00 | -1.0 | Yes |
| 4 | Pullback | 57.60 | +2.4 | Yes |
| 5 | Pullback | -14.40 | -0.6 | Yes |
| 6 | Breakout | -24.00 | -1.0 | No |
| 7 | Pullback | 36.00 | +1.5 | Yes |
| 8 | Breakout | -24.00 | -1.0 | No |
| 9 | Pullback | 21.60 | +0.9 | Yes |
| 10 | Pullback | 52.80 | +2.2 | Yes |
Trade 5 lost only 0.6R because the trader closed before the stop was hit. That is a note worth writing, since leaving early is a pattern you want to catch. Trades 6 and 8 are marked No: both were taken late in the day, right after a loss.
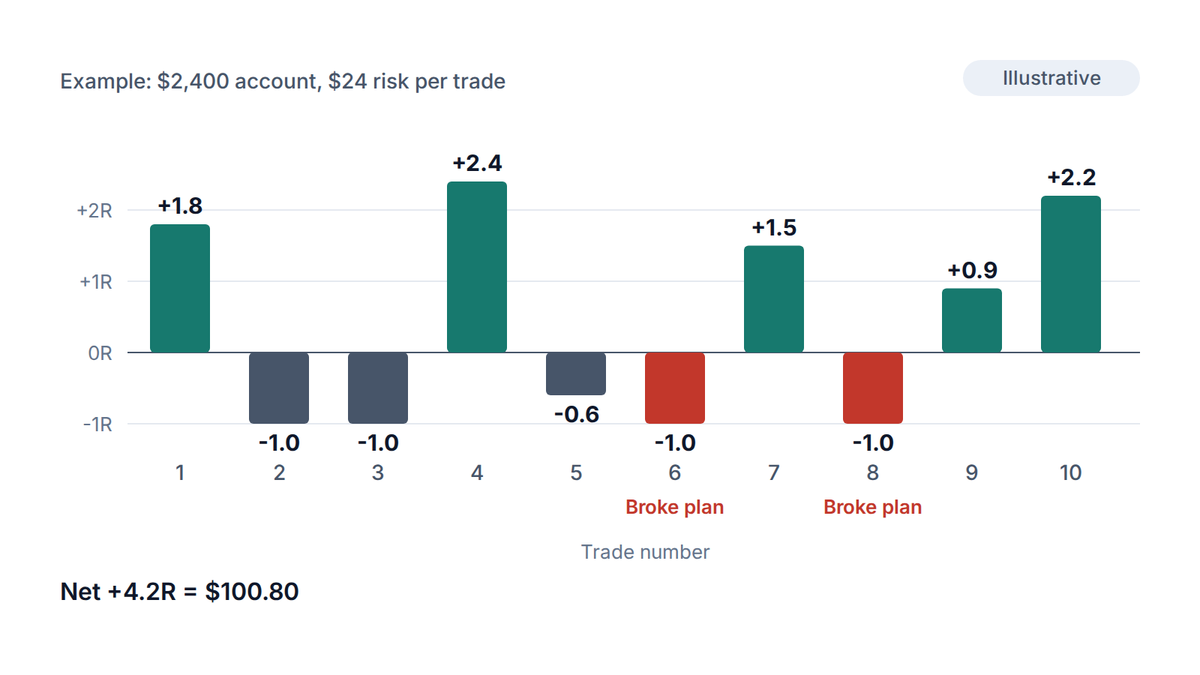
Once the rows exist, a few summary figures do the reviewing for you. In the sample, five of ten trades won, so the win rate is 50%. The average win was 1.76R and the average loss 0.92R. That gives an expectancy (the average result per trade) of +0.42R, or $10.08 per trade at $24 risk.
That looks healthy, but do not trust it yet. Ten trades is a tiny sample, and a different ten could easily average zero. The point of the example is to show how the figures are built, not to suggest a strategy works. You need many more trades before the average means much.
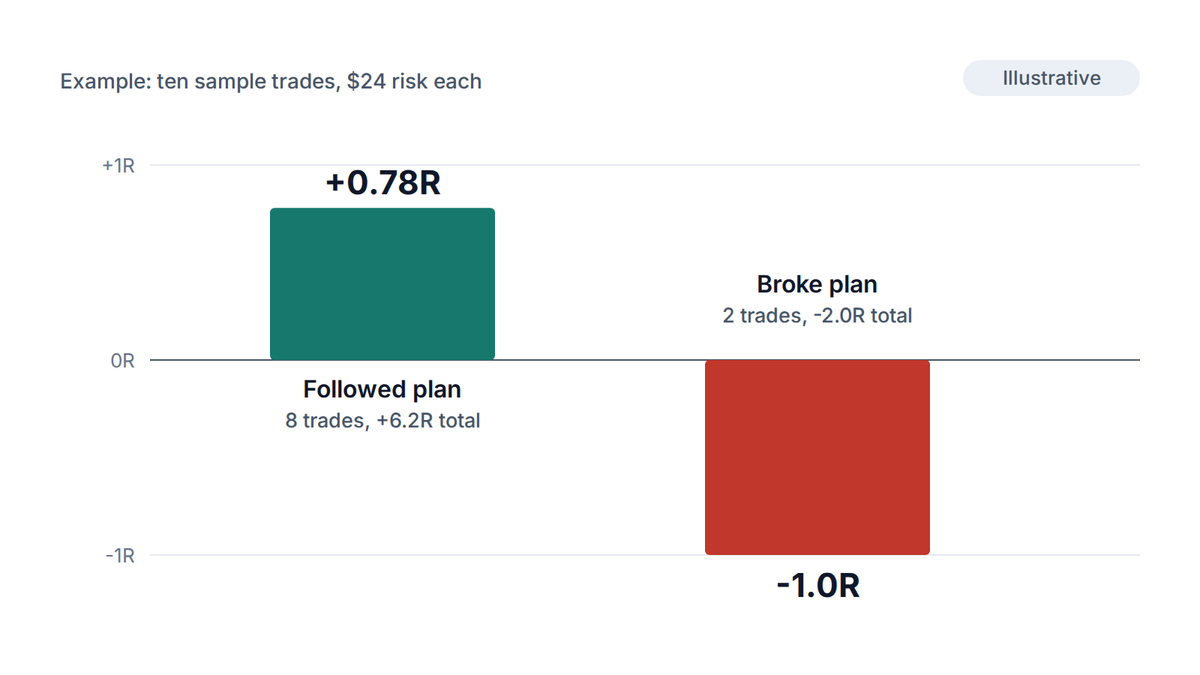
The more useful cut is the Followed plan column. The eight trades that followed the plan summed to +6.2R, an average of 0.78R. The two that broke it summed to -2.0R. Without those two, the sample would have been nearly 50% better.
Drawdown (the fall from a peak to a later low) is worth reading from the same column. Running the R values in order, the balance peaks at +1.8R after trade 1 and drops to -0.2R after trade 3, a 2.0R dip or $48. That is 2.0% of the account. See what drawdown is for how it compounds.
Search for a trading journal template Google Sheets users share and you will find dozens, most with far too many columns. Building your own takes less time than learning someone else's. Use the same twelve headers in either tool.
Put the headers in row 1, in the order of the table above, so Risk ($) is column G, Result ($) is column I, R is column J and Followed plan is column K. Then add these formulas.
Turn on data validation for the Direction, Setup and Followed plan columns so each is a drop-down. That one step keeps the labels consistent, which is what makes the averages work.
A Notion trading journal template is a database in table view. Match each column to a property type, then group and filter instead of writing formulas for every summary.
Notion is better if you want to attach a chart screenshot to each trade. Sheets is better if you want fast averages and a running total. Either works, so pick the one you already open every day.
About a downloadable file
PipsMorrow does not offer a downloadable journal file yet. The column list and the formulas above are everything you need to build one, and building it yourself means you understand each cell.
A journal helps only if the rows exist. The way to keep it going is to make each entry small and tie it to something you already do, such as closing a position.
Use the Note column to catch emotional patterns early. If three notes in a row say "angry" or "had to get it back", read the guide to revenge trading and set a daily loss limit. The journal is where you see the pattern first.
Try it now
Your journal's Risk ($) column should match what you planned. Enter your balance, risk percentage and stop distance to get the lot size that keeps each trade near the same dollar risk.
At minimum: the date, instrument, direction, setup, entry, stop, risk in money, exit, result, the result in R, a Yes or No for whether you followed your plan, and a one-line note. Those twelve columns cover what you need to review.
PipsMorrow does not offer a file yet. You can build a free trading journal in Google Sheets or Notion in about twenty minutes using the columns and formulas on this page. Both tools have free plans.
For rule-following, a few weeks of entries is enough to see patterns. For judging whether a strategy has an edge, you need far more trades, often well over a hundred. Treat early averages as a rough guide only.
Use whichever you will open every trading day. Spreadsheets give quick math, Notion gives flexible views and apps can import trades automatically. The columns matter more than the tool you pick.
The PipsMorrow Team
A team of writers covering XAU/USD gold trading education. We focus on explaining the mechanics and risk management in a structured way, with no trade signals and no promotion of any specific broker.
Last updated
Gold price vs interest rates: why the real yield, not the headline rate, drives gold, where that link broke after 2022, and how to size trades around it.
10 min read
Read more →A candlestick patterns cheat sheet with 12 bullish and bearish patterns, plus the context each one needs before it means anything. Save the grid and use it.
8 min read
Read more →Gold contract specifications, line by line: contract size, digits, spread, swap, margin and hours, with each one turned into dollars per trade.
9 min read
Read more →Build on this article with the full gold trading curriculum, ordered from the basics to advanced topics, free.

