Candlestick Patterns Cheat Sheet: 12 Patterns on One Page
A candlestick patterns cheat sheet with 12 bullish and bearish patterns, plus the context each one needs before it means anything. Save the grid and use it.
By the PipsMorrow TeamUpdated 8 min read
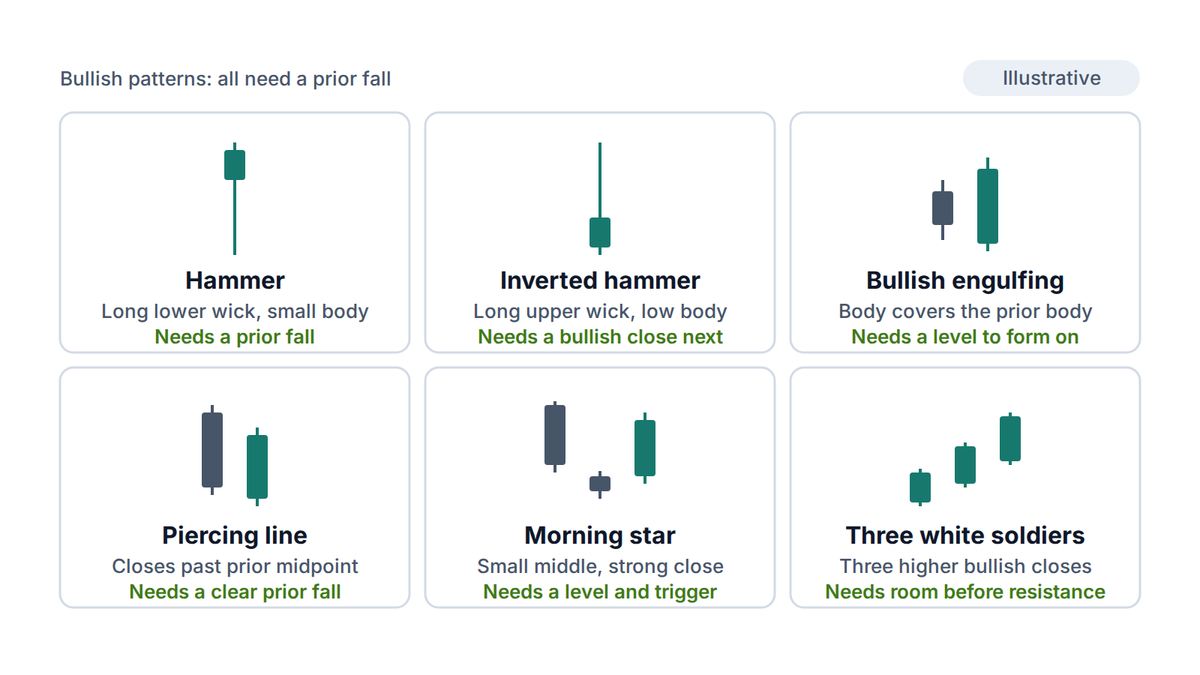
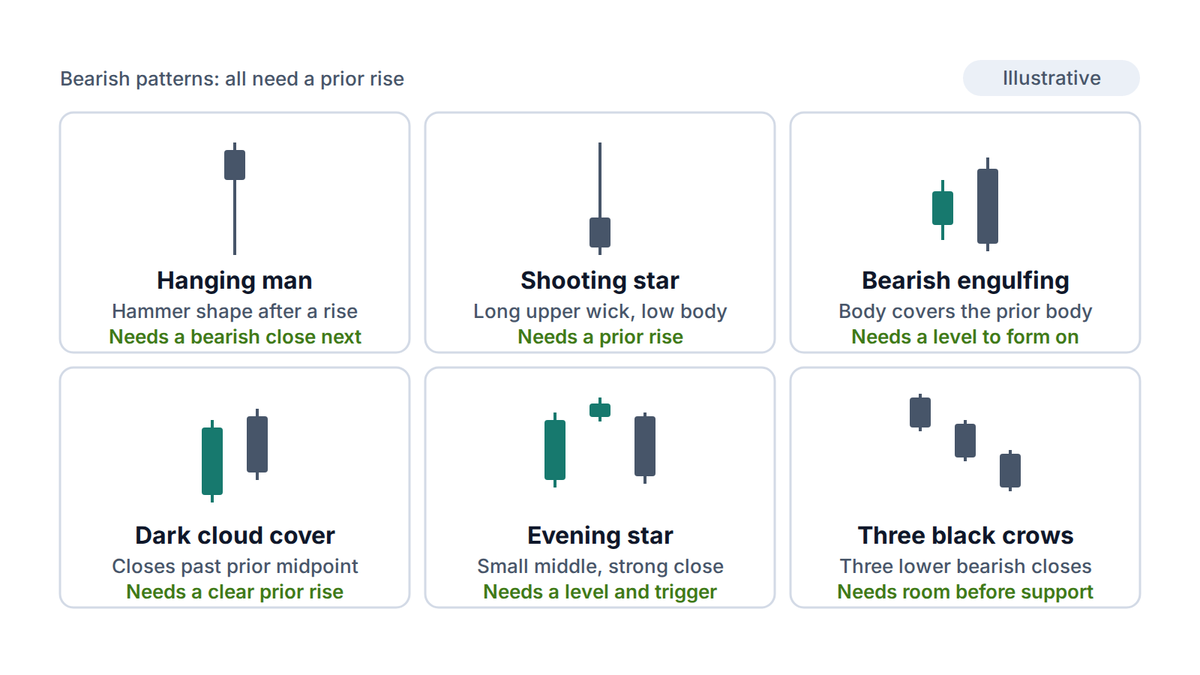
This candlestick patterns cheat sheet puts the twelve patterns you will see most on one page: six bullish, six bearish. Every pattern is drawn, named and paired with the one thing it needs before it means anything.
A shape on its own is not a reason to trade. That is why the sheet lists the condition next to each name, then explains the checks that apply to all twelve. Save the figures, or print the page, and keep them beside your chart.
Key takeaways
Twelve patterns cover most of what you will use: six bullish and six bearish, each the mirror of the other.
Bullish candlestick patterns need a fall to reverse. Bearish candlestick patterns need a rise to reverse. Without that prior move, there is nothing to turn.
Every pattern gains weight at a level you marked beforehand, and loses it in the middle of a range.
Single-candle patterns such as the hammer and shooting star usually need a trigger: a later candle that closes beyond the pattern.
A pattern is a description of what already happened. Set the stop loss beyond its extreme, size the position from that distance, and skip the trade if the numbers do not work.
How to read this cheat sheet
A candlestick shows four prices for one period: the open, the high, the low and the close. The body is the distance between open and close. The wicks (the thin lines above and below) show how far price moved before it was pushed back.
On the figures below, teal candles close higher than they opened, and dark grey candles close lower. The same colors are used for every pattern, so you can compare shapes at a glance. Each tile carries the pattern name and a short line on what it needs.
If you came looking for a candlestick patterns pdf, there is no file to download here. The grids are plain images, so you can save them to your device, or use your browser's print-to-PDF option on this page. The detail you need sits in the tiles and the tables.
Bullish candlestick patterns appear after a fall. They describe sellers pushing price down and buyers answering. Three are single or double candles that form fast. Three take longer and, because they use more candles, tend to be more selective.
Six bullish patterns and the one condition each needs. All six assume a fall comes first.
The three-candle patterns are rarer and slower, which is why many traders trust them a little more.
Pattern
Candles
What it shows
Needs
Hammer
1
Sellers pushed down, buyers recovered to close near the high.
A prior fall, then a close above its high.
Inverted hammer
1
Buyers pushed up but could not hold it, yet sellers failed to close it lower.
A bullish candle after it. Weaker alone.
Bullish engulfing
2
A bullish body covers the whole previous bearish body.
A marked support level nearby.
Piercing line
2
A bullish candle closes above the midpoint of the prior bearish body.
A clear fall into it.
Morning star
3
Bearish candle, small indecisive candle, then a strong bullish close.
A level, and a close above the pattern.
Three white soldiers
3
Three bullish candles, each closing higher than the last.
Space before the next resistance.
The inverted hammer and the three white soldiers deserve a warning. The first looks like a reversal but shows buyers failing, so it leans on the next candle. The second arrives after the move has already started, which can leave your stop a long way away.
Bearish candlestick patterns
Bearish candlestick patterns are the mirror image. They appear after a rise, and they describe buyers pushing price up while sellers answer. Each bearish pattern has a bullish twin in the grid above, with one exception worth noticing.
Six bearish patterns and the one condition each needs. All six assume a rise comes first.
The hanging man is the one pattern whose shape is identical to its bullish twin. Only its position tells them apart.
Pattern
Candles
What it shows
Needs
Hanging man
1
A hammer-shaped candle, but at the top of a rise.
A bearish candle after it.
Shooting star
1
Buyers pushed up, sellers recovered to close near the low.
A prior rise, then a close below its low.
Bearish engulfing
2
A bearish body covers the whole previous bullish body.
A marked resistance level nearby.
Dark cloud cover
2
A bearish candle closes below the midpoint of the prior bullish body.
A clear rise into it.
Evening star
3
Bullish candle, small indecisive candle, then a strong bearish close.
A level, and a close below the pattern.
Three black crows
3
Three bearish candles, each closing lower than the last.
Space before the next support.
That exception is the clearest lesson on the sheet. The hammer and the hanging man are the same candle. After a fall it is called a hammer, and after a rise it is a hanging man. The shape did not change. The context did, and so did the name.
The piercing line, dark cloud cover and star patterns were defined for markets that gap between sessions. Forex and gold trade nearly around the clock, so a candle often opens near the previous close. Treat the gap in those definitions as a loose guide, not a strict rule.
What every pattern needs before it means anything
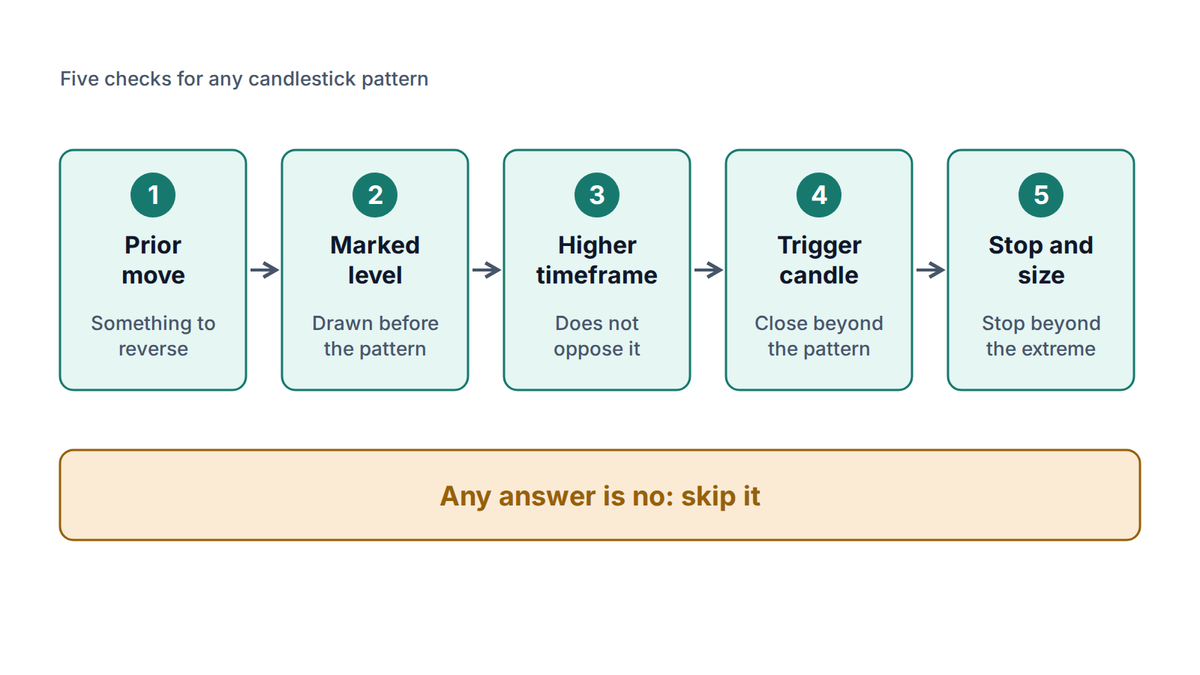
The twelve patterns have different shapes, but the same five questions decide whether any of them matters. Work through them in this order. If you cannot answer the first two, stop there.
Five checks apply to all twelve patterns. A no on any of them is a reason to skip the trade.
A move to reverse. A bullish pattern needs a fall before it, and a bearish one needs a rise. In a sideways wobble, the same candles are noise.
A level you marked first. A hammer on a support zone you drew yesterday tells a story. The same hammer in empty space does not. Learn to mark levels with support and resistance that hold.
A higher timeframe that does not oppose it. A bullish pattern on the 1-hour chart inside a steep daily downtrend is usually a pause. See multi-timeframe analysis.
A trigger candle. Many patterns fail on the very next candle. Waiting for a close beyond the pattern costs part of the move and filters out some failures.
A stop and a size that work. Place the stop loss (an order that closes the position at a set price) beyond the pattern's extreme, then size the position from that distance.
The last check often decides the matter. A long, tall pattern forces a wide stop, which forces a small lot (the volume of a position). If that size falls below your broker's minimum or your risk limit is exceeded, there is no trade. The lot size calculator does the sum in seconds.
Try it now
Enter your stop distance before you act on any pattern, so the pattern never sets your risk.
A cheat sheet of candlestick chart patterns is not complete without the candles that say nothing about direction. They are worth recognizing mostly so you do not mistake them for signals.
Doji. Open and close are almost equal, so the body is a thin line. It shows indecision. It is useful mainly as the middle candle of a morning or evening star.
Spinning top. A small body with wicks on both sides. Neither side won the period. It often appears when a trend is pausing.
Inside bar. A candle whose high and low sit entirely within the previous candle's range. Price is compressing, and the next break decides the direction.
None of these is bullish or bearish by itself. They tell you the market hesitated, and they are a prompt to watch the next candle rather than act.
Why the sheet cannot do the thinking for you
A pattern is a label put on candles after they have formed. Markets are driven by news, order flow and traders on other timeframes, so even a textbook shape fails often. Four habits keep a cheat sheet honest.
Expect failures. A fall can print three hammers on the way down. Each looked right on its own.
Use higher timeframes. On a 1-minute chart, patterns form constantly and most mean nothing. The 4-hour and daily charts give fewer and more meaningful ones.
Write rules down. One trader's engulfing candle is another's inside bar. Fixed rules stop you from seeing what you want to see.
Judge over many trades. One result tells you little. Keep a journal and review what each pattern did at your levels.
A candlestick pattern is not a signal and nothing here is a trade recommendation. Leveraged products such as forex and gold CFDs can lose money quickly, so test any routine on a demo account first.
Frequently asked questions
What are the most common candlestick chart patterns?
The hammer, shooting star, engulfing patterns, morning star and evening star are the most widely used. The sheet above adds the inverted hammer, hanging man, piercing line, dark cloud cover and the three-candle soldiers and crows.
Which are the strongest bullish candlestick patterns?
No pattern is strong on its own. Three-candle patterns such as the morning star are more selective, but the location matters more than the name. A bullish pattern at a marked support level after a fall carries more weight than any pattern in open space.
How do I tell bearish candlestick patterns from a pause?
Look for a clear prior rise, a marked resistance level, a higher timeframe that agrees, and a candle that closes below the pattern. If several are missing, assume the market is pausing rather than turning.
Is there a candlestick patterns pdf I can download?
This page does not offer a PDF file. The two grids are images you can save, and your browser's print-to-PDF option will capture the page. The tables in the page repeat the grid in text form, so you can copy them into your own notes.
◆
The PipsMorrow Team
A team of writers covering XAU/USD gold trading education. We focus on explaining the mechanics and risk management in a structured way, with no trade signals and no promotion of any specific broker.
Reversal candlestick patterns only mean something in the right place. Learn the few that matter, the context each needs, and how to set a stop and size.
Use this trading journal template with 12 columns, a ten-trade sample and formulas for Google Sheets or Notion, so you can track R, rule breaks and edge.