
Technical analysis
ATR Indicator: How to Read It and Size Stops
The ATR indicator measures how far price normally moves. Learn how to read it, how it is calculated and how to size stops, targets and lots with it.
11 min read
Read more →
Stop loss in trading explained: what a stop does, how to place it behind market structure, and how an ATR stop sizes it to volatility, with a gold example.
Stop loss in trading is the price at which you accept that a trade idea was wrong and get out. It is the one decision you make before you enter that caps what the trade can cost you. Where you put it matters as much as the entry itself.
This article explains what a stop loss does and then gives you two ways to place it: behind market structure, and at a multiple of the ATR (average true range, a volatility measure). A gold example on the site's $2,400 account with 1% risk shows how the two work together.
A stop loss is a standing instruction to your broker to close a position if price reaches a level you chose. If you buy gold at $4,300 and set a stop at $4,282, the position closes when the market trades down to $4,282. The loss is about $18 per ounce, plus a little for the spread (the gap between the buy and sell price).
People searching for what a stop loss means in trading often want a one-line answer: it is your pre-set exit for a losing trade. The longer answer is that it turns an open-ended risk into a known number. Once the stop is fixed, you can work out how many lots (the standard unit of trade size) to open so a loss costs, say, 1% of the account.
The lesson on where a stop belongs covers the idea step by step. Here we focus on the practical question: at which price?
Most weak stops fail one of two tests. Either they sit where the idea is still alive, so a small wobble takes you out for no reason, or they sit so far away that the loss is too big to size sensibly. A good stop answers both questions.
The first question gives the stop a reason. The second stops it from sitting inside the daily noise. Neither one asks how much you would like to risk. That comes later, when you size the lot.
Market structure is the sequence of swing highs and swing lows that price leaves behind. In an uptrend, each pullback holds above the last swing low. If price breaks below that low, the pattern of higher lows is broken and the buy idea has failed.
That gives you the rule. For a buy, put the stop just below the most recent swing low that supports the idea. For a sell, put it just above the swing high. The support and resistance lesson shows how to find levels that have held more than once, and gold support and resistance applies it to XAU/USD.
Placing the stop exactly on the low is a mistake. Price often probes just past an obvious level before turning, and a stop sitting right there is easy to hit. Add a small buffer beyond the level. Many traders use a fraction of the ATR for it, or a round number of dollars on gold.
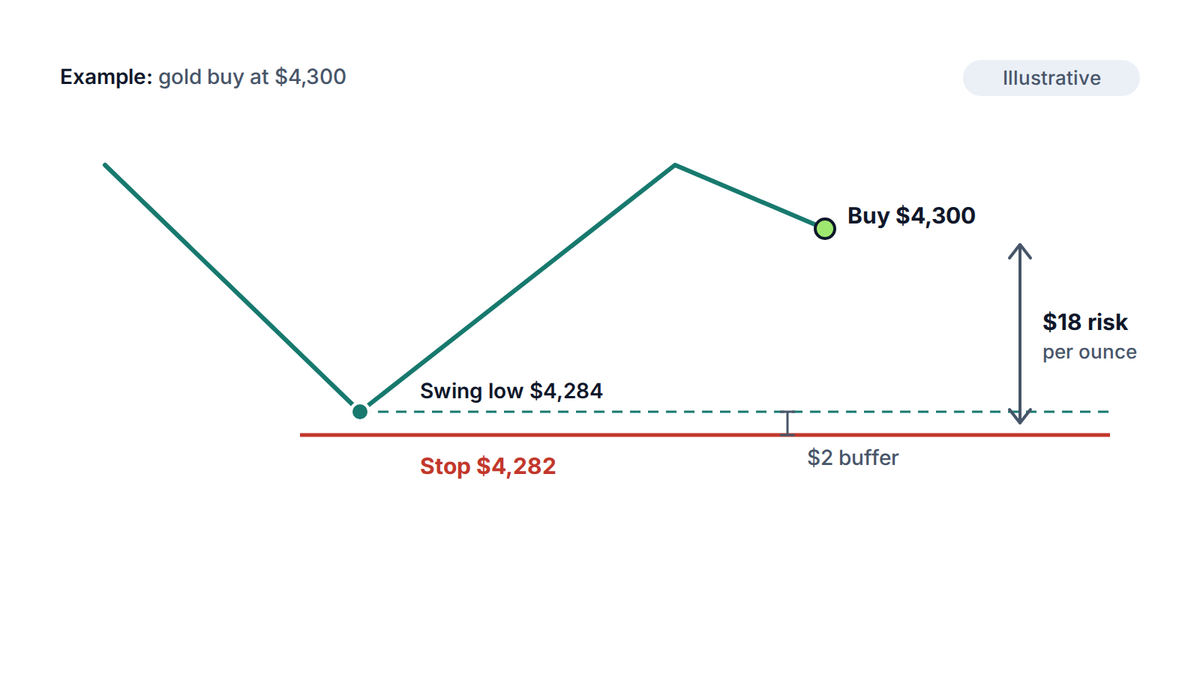
Take the gold example. You plan a buy at $4,300 after a pullback. The last swing low is $4,284. You add a $2 buffer and set the stop at $4,282. The distance is $18, and the idea is wrong if price trades below that low.
Structure stops have a weakness: they ignore how big the market's normal swings are. A swing low 40 cents away looks tidy, but on a day when gold moves $30 it is only noise. That is where volatility comes in.
The ATR is the average of the last 14 candles' true range by default. True range is the largest of three numbers: the candle's high minus its low, the high minus the previous close, and the previous close minus the low (taken as positive). It captures gaps as well as the candle itself.
A quick example: the previous close is $4,290, and this candle ranges from a low of $4,298 to a high of $4,312. High minus low is $14. High minus previous close is $22. Previous close minus low is a negative number, so its size is $8. The true range is the largest, $22. Averaging that over 14 candles gives the ATR. The lesson on ATR and bands covers it in more depth.
What each variable means:
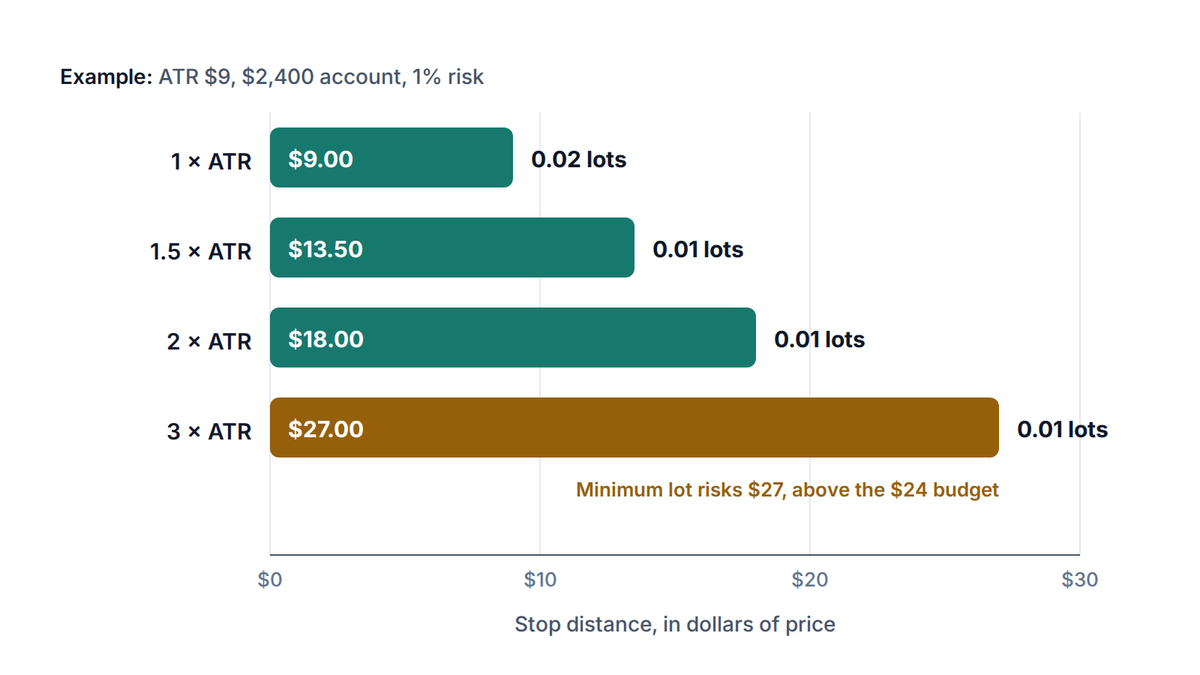
An ATR stop loss ties the distance to the market's current mood. In a quiet week the stop tightens. When volatility rises the stop widens, and the lot size shrinks to keep the dollar risk the same. Say the hourly ATR on gold is $9 (an assumed figure for this example). The table shows four multiples for a buy at $4,300.
| Multiple | Distance | Stop price | Lot size for $24 risk | Actual risk |
|---|---|---|---|---|
| 1 × ATR | $9.00 | $4,291.00 | 0.02 | $18.00 (0.75%) |
| 1.5 × ATR | $13.50 | $4,286.50 | 0.01 | $13.50 (0.56%) |
| 2 × ATR | $18.00 | $4,282.00 | 0.01 | $18.00 (0.75%) |
| 3 × ATR | $27.00 | $4,273.00 | 0.01 | $27.00 (1.13%) |
Two things stand out. First, the lot size falls as the stop widens, because $1 of price on one lot is worth $100. Second, at 3 × ATR the correct size is under the 0.01 minimum. The smallest trade you can open risks $27, which is above your 1% budget. The honest answer there is a smaller risk or no trade.
Which timeframe's ATR?
Use the ATR of the timeframe you read your entry on. A trade planned on the hourly chart uses the hourly ATR. A stop sized from the daily ATR on an hourly entry is far too wide, and a stop from a 5-minute ATR is likely too tight for an hourly idea.
Neither method is complete alone. Structure tells you where the idea fails, and the ATR tells you whether that point is far enough from the noise. Use structure to pick the level, then use the ATR as a check on the distance.
In the gold example the structure stop is $18 away, which equals 2 × the $9 ATR. The two methods agree, so the stop is both logical and outside the noise. That is the best case, and it is not guaranteed. Here are the three outcomes to expect.
| Structure stop vs ATR | What it means | What to do |
|---|---|---|
| Under 1 × ATR | The stop sits inside normal noise and is likely to be hit by a random swing | Move it beyond the level plus a larger buffer, or skip the trade |
| 1.5 to 3 × ATR | The stop has a reason and room to breathe | Size the lot from this distance |
| Over 3 × ATR | The idea needs more room than your risk budget allows | Wait for a closer entry, reduce risk per trade, or pass |
Notice what you never do: tighten the stop so the lot size looks bigger. Moving the stop closer than the idea allows turns a trade with a reason into a coin flip with a deadline. If the correct stop makes the position too small to be worthwhile, that tells you about the setup, not about the stop.
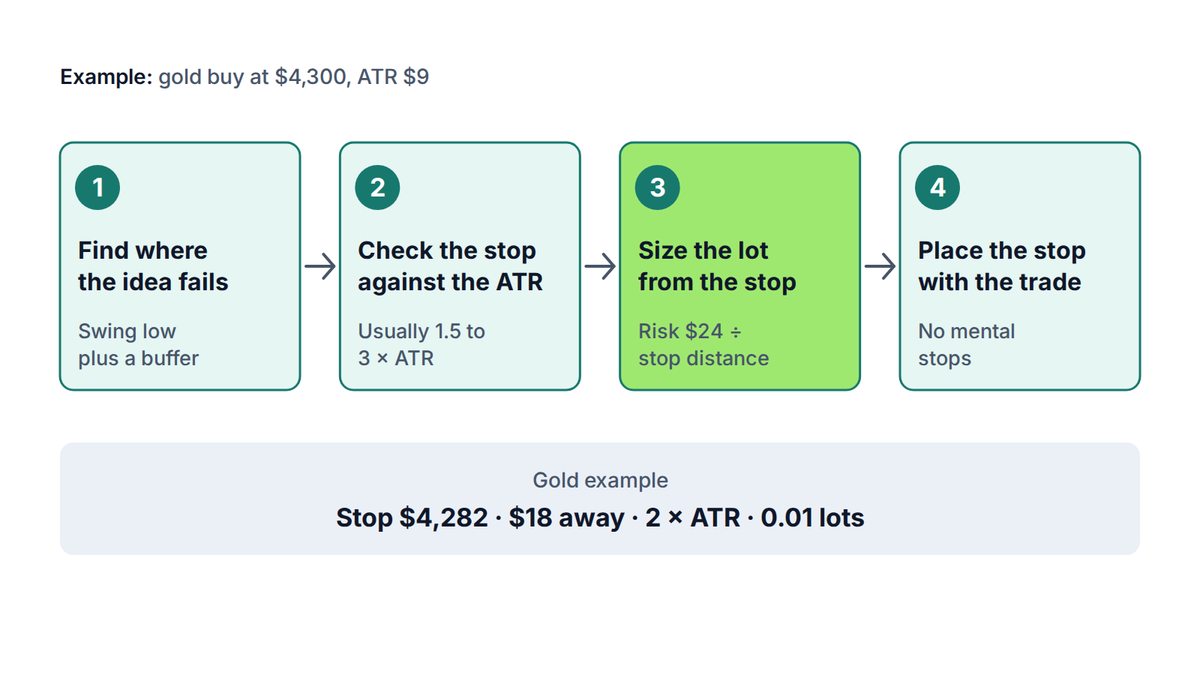
Once the stop is set, the lot size follows from your risk budget. Use the lot size calculator with your balance, risk percentage and the stop distance, and read how to size a position for the full routine. The distance you chose also sets your reward target, which the risk-reward ratio article covers.
Try it now
Enter the stop distance from your chart, not a distance you wish for. The calculator returns the largest lot size that keeps the loss at or below your risk percentage.
A stop is not a cap on loss in every market
Around major releases such as US jobs data, or over a weekend, price can jump past your stop and fill at the next available price. Your loss can then exceed the amount you planned. Keep the risk per trade small enough to survive that.
A stop loss is an order that closes your position when price reaches a level you chose, in order to limit the loss. You set it when you open the trade, and the distance to it decides your lot size.
It means your planned exit for a losing trade. The phrase covers both the order itself and the price level where your idea is proven wrong. It is a risk limit, not a prediction.
Take the 14-period ATR on your trading timeframe and multiply it by 1.5 to 3. Subtract the result from your entry for a buy, or add it for a sell. A $9 ATR at 2 times gives an $18 stop.
Not by itself. A tight stop loses less per trade but gets hit more often. A wide stop is hit less often but needs a smaller position. Place it by structure and volatility, then size the position to fit.
On a leveraged account, yes, in nearly every case. Without a stop, a single adverse move can cost far more than planned. If you choose to manage risk another way, you still need a defined exit and a defined loss before you enter.
The PipsMorrow Team
A team of writers covering XAU/USD gold trading education. We focus on explaining the mechanics and risk management in a structured way, with no trade signals and no promotion of any specific broker.
Last updated
The ATR indicator measures how far price normally moves. Learn how to read it, how it is calculated and how to size stops, targets and lots with it.
11 min read
Read more →Gold support and resistance at gold's own scale: size zones from ATR, score each XAU/USD level with five checks, then set the stop and lot size from it.
10 min read
Read more →How to size a position on gold to the risk you can afford: a five-step routine, worked numbers on a $2,400 account and the traps that turn 1% into 10%.
8 min read
Read more →Build on this article with the full gold trading curriculum, ordered from the basics to advanced topics, free.

