The ATR indicator measures how far price normally moves. Learn how to read it, how it is calculated and how to size stops, targets and lots with it.
By the PipsMorrow TeamUpdated 11 min read
The ATR indicator answers one plain question: how far does price usually move in a single candle? It does not tell you where price is going. It tells you how big the swings are, and that is exactly what you need to know before you pick a stop loss or a target.
This article explains what ATR is in trading, how it is calculated, how to read the line on your chart and how to turn it into stop distances, targets and lot sizes. The worked example uses gold (XAU/USD) on the site's shared $2,400 account with 1% risk per trade. All prices are assumed for the example.
Key takeaways
ATR stands for average true range. It is the average size of recent candles, in the same units as price, so on gold it is read in dollars.
The ATR never points up or down. A rising line means candles are getting bigger, and a falling line means they are getting smaller, whichever way price moves.
True range is the largest of three gaps: high minus low, high minus the previous close, and the previous close minus the low. Counting gaps is what separates it from a plain candle height.
Read ATR against its own recent history and on the timeframe you trade. A value of $9 means little until you know whether last month looked like $5 or $15.
A common use is a stop at 1.5 to 3 times the ATR. Because a wider stop forces a smaller lot, the same $24 risk buys fewer lots when the ATR rises.
What the ATR indicator measures
ATR was introduced by J. Welles Wilder Jr. in his 1978 book New Concepts in Technical Trading Systems. The name is literal. It is the average of the true range over a set number of candles, and the standard setting is 14. You will find it on most charting platforms, including MetaTrader 5, as Average True Range.
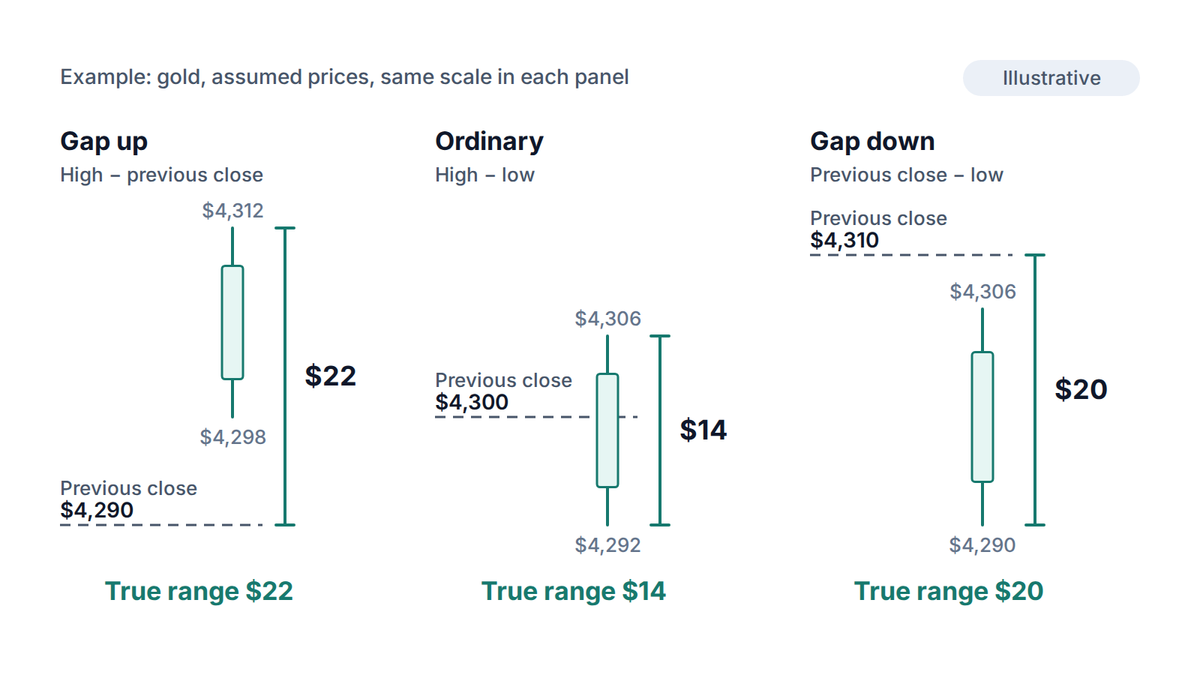
Why "true" range? A candle's height, high minus low, misses the gaps between candles. If gold closes at $4,290 and the next candle opens and trades entirely above $4,298, the market moved at least $8 before that candle even began. True range counts that move too.
True range = the largest of (high − low), |high − previous close|, |low − previous close|
What each variable means:
high − low — The height of the candle itself
|high − previous close| — How far the high is from the last close, which captures a gap up
|low − previous close| — How far the low is from the last close, which captures a gap down
The bars around the formula (|…|) mean you take the size of the number and ignore its sign. The three candles below show when each of the three terms wins.
Assumed gold prices. The largest of the three measures in each row is the true range.
Candle
Previous close
High
Low
High − low
|High − close|
|Low − close|
True range
Gap up
$4,290
$4,312
$4,298
$14
$22
$8
$22
Ordinary
$4,300
$4,306
$4,292
$14
$6
$8
$14
Gap down
$4,310
$4,306
$4,290
$16
$4
$20
$20
True range is the longest of three distances. In the gap panels it is measured from the previous close, not from the candle alone.
How the ATR is calculated
Once each candle has a true range, the first ATR is a simple average of the first 14. After that, Wilder's method smooths it: take 13 parts of the old ATR, add 1 part of the newest true range, and divide by 14.
New ATR = (old ATR × 13 + latest true range) ÷ 14
What each variable means:
old ATR — The ATR on the previous candle
latest true range — The true range of the candle that just closed
14 — The default period; a shorter period reacts faster and a longer one is smoother
Suppose 14 hourly gold candles have true ranges of $8, $10, $7, $9, $11, $8, $9, $10, $6, $9, $12, $8, $9 and $10. They add up to $126, so the first ATR is $126 ÷ 14 = $9.00. Then the gap-up candle from the table closes with a true range of $22.
The new ATR is ($9.00 × 13 + $22) ÷ 14 = $9.93. One large candle lifted the average by 93 cents, not by the full $13 jump. If the next candle has a true range of $8, the ATR eases to ($9.93 × 13 + $8) ÷ 14, or $9.79. That slow response is the point: the ATR describes the recent mood of the market, and one bar does not change it much.
Your platform does this for you, so you will never calculate it by hand on a live chart. Knowing the mechanics still matters, because it explains why the line lags and why a single spike fades slowly. Some platforms use a plain average instead of Wilder's smoothing, so two charts can show slightly different values for the same market.
How to read the ATR indicator
The ATR sits in its own panel under the price chart as a single line. There are no overbought or oversold zones and no crossovers. You read it in four ways.
The value is a distance. A reading of 9.00 on an hourly gold chart means that, recently, the average hourly candle has covered about $9 of true range.
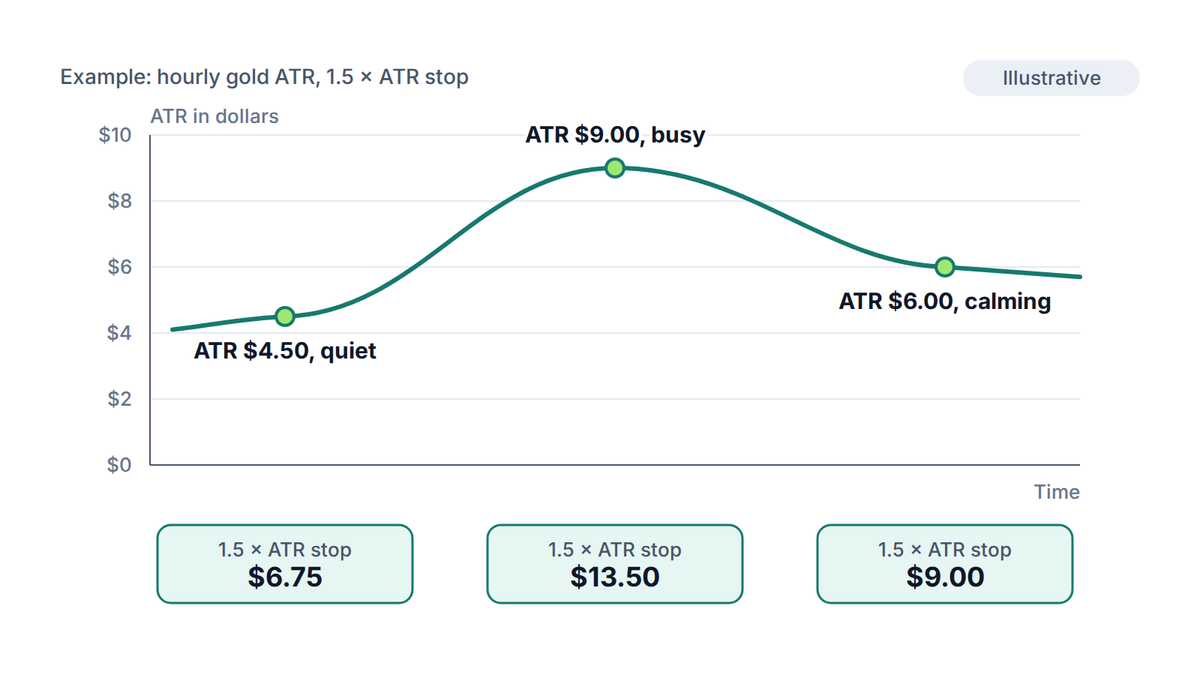
The slope is the volatility trend. A rising ATR means candles are getting bigger. A falling ATR means the market is quieting down. Neither says anything about direction.
The level only means something against history. Look back over the last few weeks on the same timeframe. An ATR of $9 is high in a month that mostly sat near $5 and low in a month that mostly sat near $15.
The timeframe changes everything. The daily ATR on gold is several times the hourly ATR. Always read the panel for the chart you take your entry from.
When the ATR rises, a stop sized from it moves further away. The line shows volatility, not direction.
Some traders also express ATR as a share of price, since $9 on a $4,300 gold price is 0.21%. This makes it easier to compare gold with, say, a currency pair or with gold at a very different price level. For a single instrument on a single timeframe, the dollar value is easier to use.
The ATR sits next to other tools in the same family, such as Bollinger Bands. The lesson on volatility, ATR and bands covers how they relate.
How to use the ATR for stops and targets
The ATR gives you a yardstick for normal movement. A stop closer than one ATR to your entry sits inside the market's ordinary noise, so a random swing can hit it even when your idea is right. A common range is 1.5 to 3 times the ATR for a stop, with the multiple depending on your style and timeframe.
multiple — Often 1.5 to 3 for a stop; a choice you test, not a rule
target multiple — Set so that target distance ÷ stop distance gives the risk-reward ratio you want
sell — Reverse the signs: stop above entry, target below
Targets work the same way. If the hourly ATR is $9, a target 3 × ATR away asks price to travel $27 from your entry. That is three times the typical hourly move, so allow several hours for it, and treat the ATR as a rough guide to how realistic a target is. A stop of 1.5 × ATR with a target of 3 × ATR gives a 1:2 risk-reward ratio. The risk-reward ratio article explains why that ratio still needs a win rate behind it.
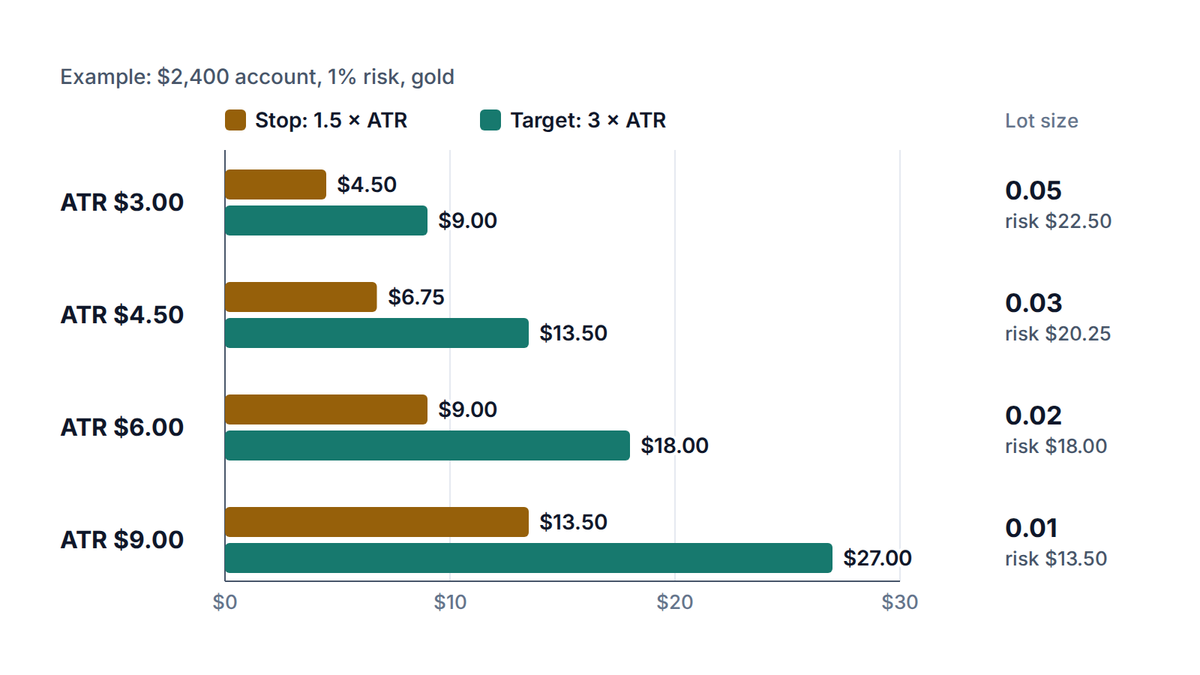
Using the ATR on your stop also protects your position size. Because $1 of price on one lot of gold is worth $100, a wider stop forces a smaller lot to keep the dollar risk fixed. The table runs a buy at $4,300 for four ATR readings, with the stop at 1.5 × ATR and the target at 3 × ATR.
Gold buy at $4,300, $2,400 account, 1% risk ($24), 100 ounces per lot. Lots are rounded down to the 0.01 step, so actual risk is at or below $24.
Hourly ATR
Stop (1.5 × ATR)
Stop price
Target (3 × ATR)
Lots for $24 risk
Actual risk
$3.00
$4.50
$4,295.50
$4,309.00
0.05
$22.50
$4.50
$6.75
$4,293.25
$4,313.50
0.03
$20.25
$6.00
$9.00
$4,291.00
$4,318.00
0.02
$18.00
$9.00
$13.50
$4,286.50
$4,327.00
0.01
$13.50
Doubling the ATR doubles the stop and the target, and the lot size that keeps the risk near $24 falls to match.
Read the last row. At a $9 ATR the 1.5 × ATR stop is $13.50, and the size that fits the budget is already down to the 0.01 minimum. Go any wider, to 3 × ATR or $27, and even the minimum lot risks more than $24. The honest options are a smaller position idea, a lower risk per trade or no trade. The lot size calculator does this arithmetic from any stop distance.
Try it now
Read the ATR from your chart, multiply it by the multiple you use, and enter the result as the stop distance. The calculator returns the lot size for your balance and risk percentage.
The ATR tells you how much room a stop needs. It does not tell you where the market would prove your idea wrong. A stop placed 2 × ATR below the entry can sit in the middle of nowhere, with no level behind it.
A sturdier habit is to find the structure level first, such as a swing low, then check its distance against the ATR. If the structure stop is under one ATR away, it is probably inside the noise. If it is more than three ATRs away, the idea needs more room than your risk budget allows. The stop loss article walks through this check, and the gold support and resistance article uses the ATR to size zones.
A quick way to use ATR as a filter
Before you take a setup, divide the distance to your target by the ATR. If the target is 6 or 7 times the hourly ATR away, price needs a long, steady run to reach it. That is not impossible, but ask whether a nearer level would be a more realistic target.
What the ATR cannot tell you
It lags. The ATR is an average of past candles. When a news release makes the market suddenly jump, the ATR is still describing the quiet period before it.
It has no direction. A big drop and a big rally both raise it. Use it to size risk, and use other tools or your own analysis for direction.
It reflects a setting you chose. A period of 14 is the default, not a law. A shorter period such as 7 reacts quickly and swings more. A longer one such as 21 is steadier.
It does not cap your loss. A stop sized from the ATR is still a stop. Around major releases or over a weekend, price can jump past it and fill at a worse level.
Volatility changes after you enter
An ATR stop is sized from conditions at the moment you open the position. If volatility doubles an hour later, your stop is now closer to the noise than you planned. Decide in advance how you will handle the big data releases on your economic calendar, and keep a risk per trade you can live with if the stop fills badly.
Used with those limits in mind, the ATR is one of the simplest ways to tie your risk to the market's real behavior. It replaces "a 50-pip stop feels right" with "a stop that is 1.5 times a typical candle", and the second statement changes with the market and the first one does not.
Frequently asked questions
What is ATR in trading?
ATR means average true range. It is an indicator that shows the average size of recent candles, including gaps, over a set number of periods (14 by default). It measures volatility, not direction, and it is displayed in the same units as price.
How do I use the ATR indicator?
Most traders use it to size a stop loss at a multiple of the ATR, often 1.5 to 3 times, and to judge whether a target is realistic. A wider ATR stop means a smaller lot size, so the dollar risk stays the same. Test the multiple on past charts before you rely on it.
How do I read the ATR indicator?
Read the value as a typical distance for the timeframe you are on, and read the slope as the volatility trend. Rising means larger candles, and falling means smaller ones. Compare today's reading with the last few weeks, because the number alone has no meaning.
What is a good ATR setting?
The default period of 14 is the most widely used, and a sensible starting point. A shorter period responds faster but is noisier, and a longer one is smoother but slower. No setting is best in every market, so check what suits the timeframe you trade.
Does a high ATR mean I should trade more?
No. A high ATR means price is moving more, which gives larger possible profits and larger losses alike. It also means wider stops and smaller lots for the same risk. Treat it as information about size, not as a signal to trade more often.
◆
The PipsMorrow Team
A team of writers covering XAU/USD gold trading education. We focus on explaining the mechanics and risk management in a structured way, with no trade signals and no promotion of any specific broker.
Stop loss in trading explained: what a stop does, how to place it behind market structure, and how an ATR stop sizes it to volatility, with a gold example.
What is a margin call? It is your broker's warning that equity is close to the margin held. See the numbers, the stop out that follows and how to avoid both.
How to size a position on gold to the risk you can afford: a five-step routine, worked numbers on a $2,400 account and the traps that turn 1% into 10%.