RSI Divergence on Gold: A 4-Step Filter Before You Act
RSI divergence on gold spots fading momentum, not reversals. Learn the four types, why they repeat in XAU/USD trends, and a 4-step filter with sizing.
By the PipsMorrow TeamUpdated 9 min read
RSI divergence on gold is usually sold as a way to catch a reversal before everyone else. The honest version is less exciting. Divergence tells you a move is slowing down, and gold can slow down several times before it actually turns.
That doesn't make divergence useless. It makes it a filter rather than a trigger. This article shows what the four types of divergence measure on XAU/USD and why they fail so often in gold's trends. It then sets out a four-step routine that attaches a stop and a size to every divergence.
RSI divergence on gold says a move is slowing, not that it is ending. Treat it as a probability.
Gold trends hard, so bearish divergence can repeat several times while price keeps rising.
Use the four-step filter: a pre-marked level, the higher timeframe, a structural trigger, then invalidation and size.
Structural stops on gold are wide. In the example, a $46.80 stop on a $2,400 account at 1% risk was below the minimum lot.
Never tighten a stop to fit a size. If the minimum lot breaks your risk budget, pass on the setup.
What RSI divergence on gold measures
J. Welles Wilder introduced the Relative Strength Index in his 1978 book New Concepts in Technical Trading Systems. RSI compares the average size of recent up-closes with recent down-closes and scales the result from 0 to 100. The default period is 14 bars.
RSI = 100 - (100 / (1 + average gain / average loss))
What each variable means:
average gain — Mean size of up-closes over the period, usually 14 bars
average loss — Mean size of down-closes over the same period
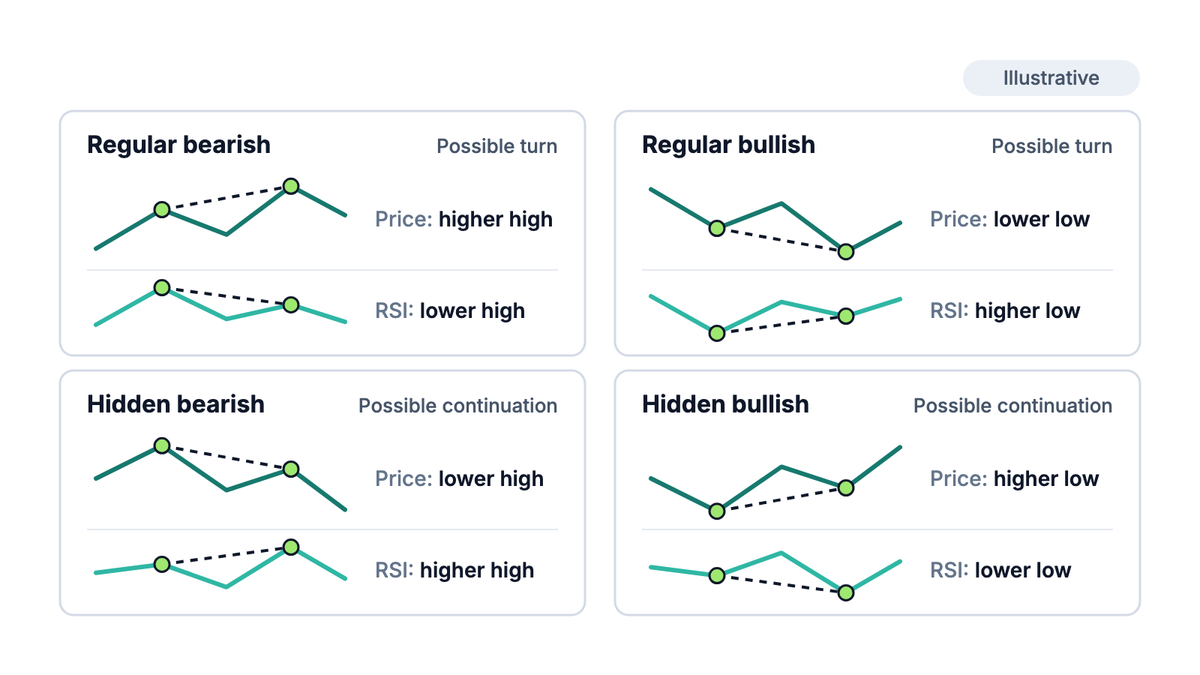
Divergence is a disagreement between price and RSI at two comparable swing points. Price makes a new extreme, but RSI doesn't confirm it. Traders sort it into four types.
Regular divergence hints at a possible turn. Hidden divergence hints at a possible continuation.
Type
Price
RSI
What it describes
Regular bearish
Higher high
Lower high
An advance losing speed
Regular bullish
Lower low
Higher low
A decline losing speed
Hidden bearish
Lower high
Higher high
A downtrend pullback with strong momentum behind it
Hidden bullish
Higher low
Lower low
An uptrend pullback with strong momentum behind it
The four types. In each, price and RSI disagree at two comparable swing points.
Read literally, every type describes the past 14 bars, not the next 14. A second high reached more slowly than the first will almost always print a lower RSI. That is arithmetic, and it is the first reason to hold divergence loosely.
Why divergence is a probability, not a signal
Three structural problems limit what divergence can tell you. None of them is specific to gold, but gold's behavior makes each one sharper.
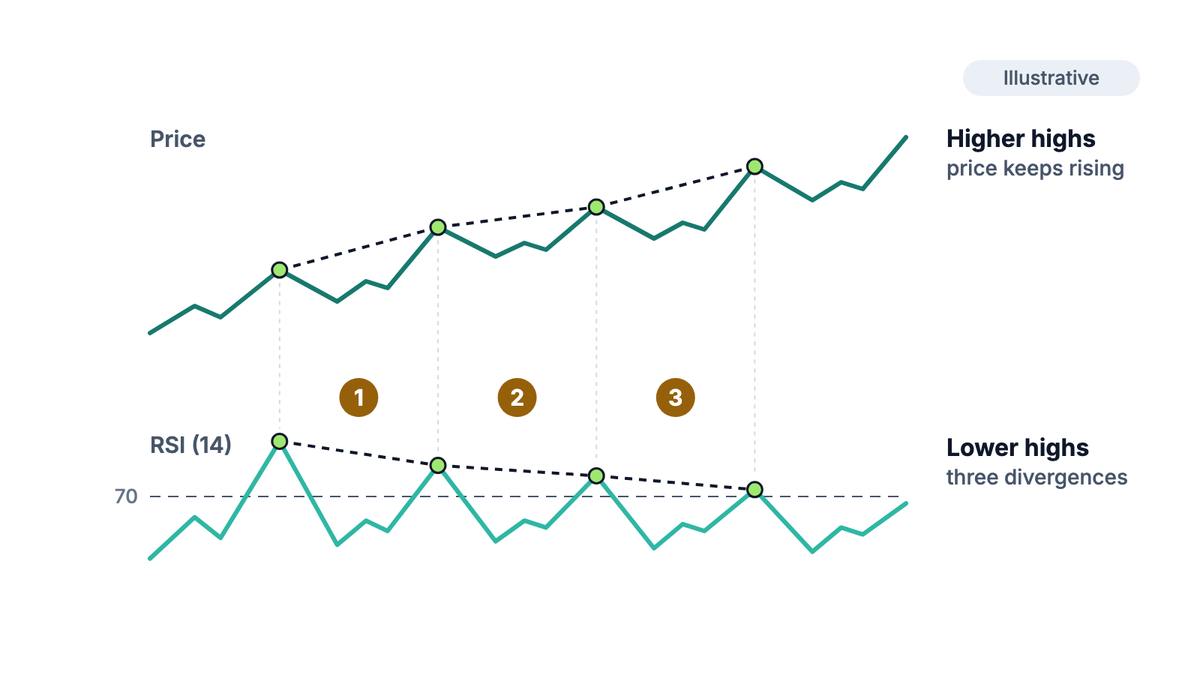
It repeats inside trends. A strong trend can produce three or four divergences in a row while price keeps going. Each one looks the same as the one that finally marks the turn.
It only exists after the fact. You need a completed second peak to see divergence. While price is building that peak, you can't know whether it's the second one or the fourth.
The winners are memorable. When divergence does mark a turn on gold, the move that follows can be large. Those examples get shared, and the failures are quietly forgotten.
Gold adds its own twist. When it trends, it tends to trend hard, and RSI can sit above 70 for weeks. In that kind of move, bearish divergence appears again and again while the price climbs. A trader who acts on each one takes a string of losses in the strongest part of the trend.
In a strong gold trend, divergence can appear several times before anything turns.
Divergence says the move is slowing. It doesn't say the move is over, and on gold those are very different statements.
Treat every divergence as a question
A divergence raises the odds that a reversal is worth watching for. It never tells you one is coming, and it never sets the stop. Many divergences on gold resolve with price continuing in the original direction.
Gold-specific traps: timeframe, session and news
Timeframe
On the 1-minute and 5-minute charts, divergence appears constantly and means very little. On the 4-hour and daily charts, it appears less often and at swing points more people are watching. If you use divergence at all, start with the higher timeframes.
Session
Gold trades almost around the clock, but liquidity is uneven. During quieter hours, a slow drift to a marginal new high can print a divergence that only reflects thin trading. The lesson Sessions, Liquidity and the Clock explains why the hour matters.
News candles
One large candle can create or erase a divergence. US Non-Farm Payrolls, for example, is released at 8:30 a.m. New York time, which is 12:30 UTC during US daylight saving time and 13:30 UTC otherwise. A single release candle can dominate a 14-bar RSI for hours afterward.
The practical rule is to note when a divergence formed. If one of the two peaks is a news spike, the comparison is between a news reaction and ordinary trading, which says little about momentum.
A four-step filter for RSI divergence on gold
This routine doesn't make divergence reliable. It only makes sure you act on a divergence when something else already gave you a reason, and that you know your exit before you enter.
Require a level. The divergence must form at a zone you marked before the session, such as a round hundred or a prior swing. Divergence in open space is ignored. The article on gold support and resistance covers how to mark those zones.
Check the higher timeframe. A bearish divergence on the 1-hour chart inside a strong daily uptrend is a pullback candidate at best. The lesson Multi-Timeframe Analysis sets out how to read the two together.
Wait for a structural trigger. The trade idea starts when price breaks the swing that formed between the two peaks. The divergence alone is not an entry.
Set invalidation, then size. The stop goes beyond the second peak, where the idea is clearly wrong. The position size follows from that distance, never the other way around.
Step four is where most gold traders get into trouble. The distance from the trigger back to the second peak is often large, which means a small position. That is the cost of using a structural stop on a volatile instrument.
Worked example: a bearish divergence at a round number
The prices below are illustrative, chosen to show the arithmetic. They are not a forecast or a trade idea. The account uses the site's shared figures: a $2,400 balance risking 1% per trade. One lot of XAU/USD is 100 troy ounces, with a troy ounce being 31.1035 g.
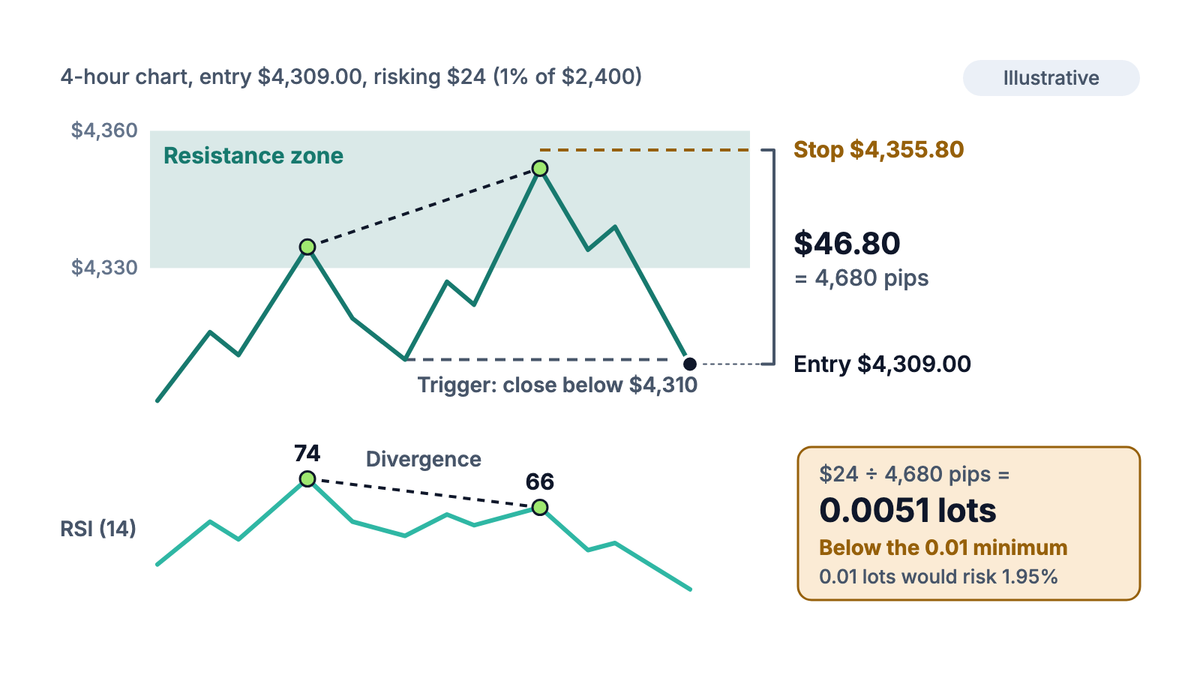
Price makes a higher high while RSI makes a lower high: regular bearish divergence.
Point on the 4-hour chart
Price
RSI (14)
First peak
$4,334.60
74
Pullback low between the peaks
$4,310.00
58
Second peak, inside a $4,330 to $4,360 resistance zone
$4,351.80
66
The divergence sits at a zone marked in advance, so step one passes. Suppose the daily chart is range-bound rather than trending, so step two passes too. The trigger comes when a 4-hour candle closes below $4,310.00, and the idea is entered at $4,309.00.
The stop goes a little above the second peak, at $4,355.80. That is $46.80 away, or 4,680 pips, where a pip is $0.01 of price on gold. With 1% risk on $2,400, the budget is $24.
Lots = $24 / (4,680 pips x $1.00 per pip per lot) = 0.0051 lots
What each variable means:
$24 — 1% of a $2,400 account balance
4,680 pips — $46.80 from entry to the stop above the second peak
$1.00 — Value of one pip on one lot of XAU/USD, which is 100 troy ounces
The answer is below the smallest tradeable size of 0.01 lots. The lot size calculator flags this. Trading 0.01 lots would risk $46.80, which is 1.95% of the account instead of 1%.
Figures from the site's lot size and profit/loss calculators.
Size
Loss if the stop is hit
Share of $2,400
0.0051 lots (not tradeable)
$24.00
1%
0.01 lots, the minimum
$46.80
1.95%
0.10 lots, the shared example size
$468.00
19.5%
The honest conclusion is that this setup is too large for the account at a 1% risk budget, since even the minimum size risks nearly double the plan. You can pass, or wait for a setup with a tighter structural stop. What you shouldn't do is tighten the stop to fit the size, because that moves it inside the zone where normal noise will reach it.
Try it now
Enter your balance, risk percentage and the stop distance in pips. The calculator shows the size, the money at risk, and a warning when the result is below the minimum lot.
Level, divergence, trigger, stop. The size comes last, from the stop distance.
Common mistakes with gold RSI divergence
Acting on the divergence itself. The divergence is context. The break of structure is the trigger, and even that can fail.
Fading a strong trend on every divergence. In a sustained gold rally, that means repeated losses. Check the higher timeframe first.
Drawing divergence between non-matching points. Compare swing high with swing high, using the same candle part each time. Mixing wicks and closes creates divergences that aren't there.
Changing the RSI period until a divergence appears. Pick a period once, usually 14, and keep it.
Tightening the stop to afford a bigger size. The stop belongs where the idea is wrong. See position sizing from a fixed risk for why size must follow the stop.
Each of these mistakes asks the indicator to be more certain than it can be. Keep the filter strict and the size honest.
Frequently asked questions
Does RSI divergence work on gold?
It describes slowing momentum accurately, which is all the calculation can do. As a reversal predictor on its own it is unreliable, especially in strong gold trends. It works best as a filter at a level you had already marked.
What is the best timeframe for RSI divergence on XAU/USD?
The 4-hour and daily charts give fewer, more meaningful divergences than the 1-minute or 5-minute charts. Lower timeframes produce so many that most are noise. Whatever you pick, confirm it against the timeframe above.
What is the difference between regular and hidden divergence?
Regular divergence compares two extremes in the direction of the move and hints at a possible turn. Hidden divergence compares two pullback points and hints at a possible continuation. Both are probabilities, and both need a trigger and a stop.
Should I use RSI 14 or a different setting for gold?
Fourteen is Wilder's default and the setting most traders see, which is a reason to keep it. Shorter periods make RSI jumpier and produce more divergences, not better ones. Choose once and don't change it to make a pattern appear.
◆
The PipsMorrow Team
A team of writers covering XAU/USD gold trading education. We focus on explaining the mechanics and risk management in a structured way, with no trade signals and no promotion of any specific broker.
Reversal candlestick patterns only mean something in the right place. Learn the few that matter, the context each needs, and how to set a stop and size.
Gold support and resistance at gold's own scale: size zones from ATR, score each XAU/USD level with five checks, then set the stop and lot size from it.
A candlestick patterns cheat sheet with 12 bullish and bearish patterns, plus the context each one needs before it means anything. Save the grid and use it.