Reversal Candlestick Patterns and the Context They Need
Reversal candlestick patterns only mean something in the right place. Learn the few that matter, the context each needs, and how to set a stop and size.
By the PipsMorrow TeamUpdated 8 min read
Reversal candlestick patterns are the part of chart reading that gets the most attention and the least scrutiny. A hammer or an engulfing candle looks like a clear message, so beginners treat each one as a signal to buy or sell.
The pattern is only the shape of one to three candles. Whether it means anything depends on what surrounds it. This article covers the few reversal patterns worth learning, then the five pieces of context each one needs before you give it any weight.
Before you start
The basics of how a candle is built are in Reading Candlesticks Without Memorizing Names. This article assumes you know open, high, low and close, and builds the context layer on top.
Key takeaways
A reversal candlestick pattern describes a fight between buyers and sellers over one to three candles. It does not predict what comes next.
Five patterns cover most of what you will see: hammer, shooting star, engulfing, morning star and evening star.
A pattern needs a prior move to reverse, a level where it forms, a higher timeframe that does not oppose it, and a trigger candle.
Put the stop loss beyond the pattern's extreme, then size the position from that distance. A wide pattern means a smaller lot.
The same shape in the middle of a range, with no level nearby, is noise. Pass on it.
What a reversal candlestick pattern shows
Each candle records four prices for its period: the open, the high, the low and the close. The body is the distance between open and close, and the wicks (the thin lines above and below) show how far price moved before being pushed back.
A reversal pattern is a short sequence of candles where one side tried to push price further and failed. A long lower wick says sellers drove price down and buyers took it back. That is a fact about one period. It is not a forecast.
Traders split these shapes into bullish candlestick patterns, which appear after a fall and hint at a turn up, and bearish candlestick patterns, which appear after a rise and hint at a turn down. The word hint matters. Every pattern below fails regularly, even when it looks textbook.
Five reversal patterns that matter
There are dozens of named patterns. Most are small variations on a few ideas, so five are enough to start. Here is each one, the story it tells and what it does not tell you.
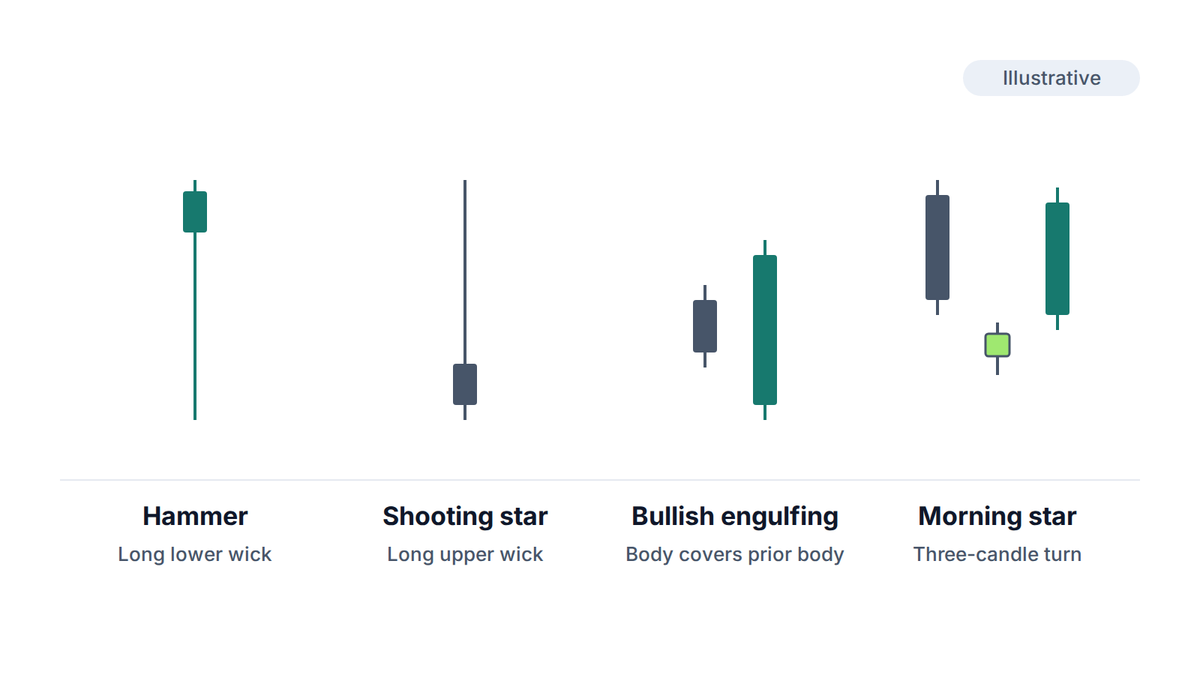
Six shapes, five ideas. The shooting star is the hammer turned upside down, and the evening star mirrors the morning star.
Pattern
Where it forms
Candles
The story
Hammer
After a fall
1
A long lower wick and a small body near the high: sellers pushed down, buyers recovered.
Shooting star
After a rise
1
A long upper wick and a small body near the low: buyers pushed up, sellers recovered.
Bullish engulfing
After a fall
2
A bullish body that fully covers the prior bearish body.
Bearish engulfing
After a rise
2
A bearish body that fully covers the prior bullish body.
Morning star
After a fall
3
A bearish candle, a small indecisive candle, then a strong bullish close.
Evening star
After a rise
3
A bullish candle, a small indecisive candle, then a strong bearish close.
Four of the five patterns as shapes. The evening star is the morning star mirrored, and the bearish engulfing mirrors the bullish one.
A doji, where open and close are almost equal, deserves a mention. It shows indecision, not reversal. It becomes useful only as the middle candle of a morning or evening star.
The five pieces of context that matter
A shape tells you what happened inside a few candles. Context tells you whether anyone should care. Before you act on any of the patterns above, check these five things in order.
1. There is a move to reverse
A hammer needs a fall before it, and a shooting star needs a rise. The same candle in a sideways market has nothing to reverse. Look for a clear run of candles in one direction, not a wobble.
2. It forms at a level you already marked
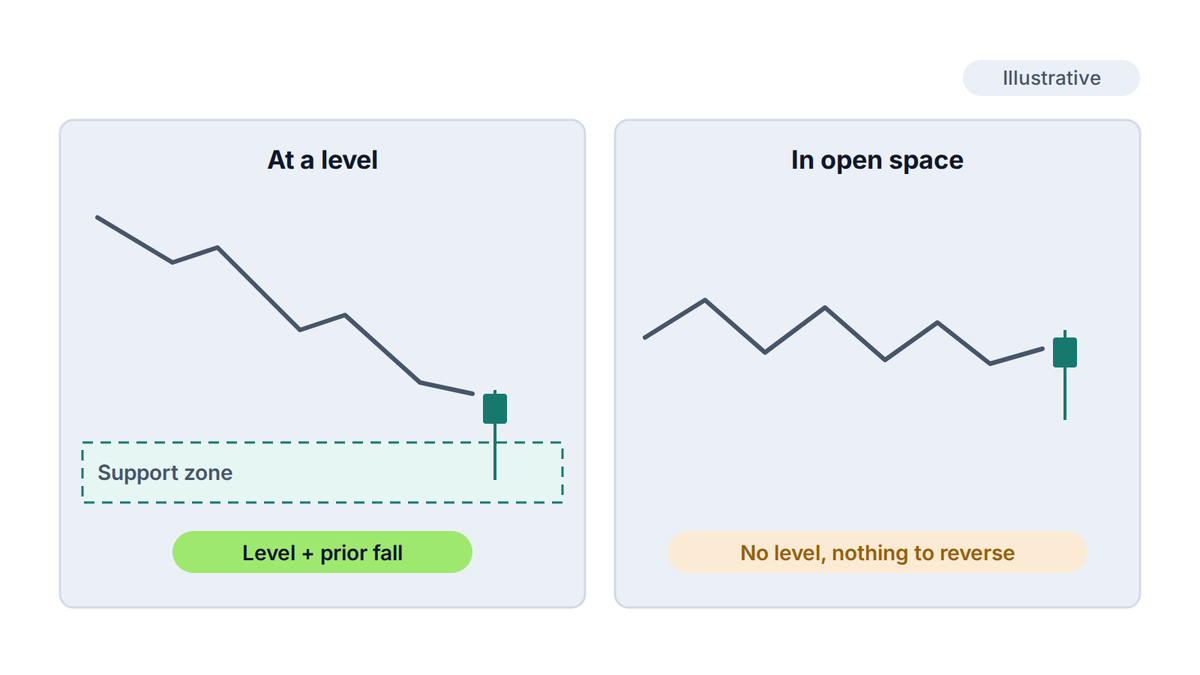
This is the piece that does the most work. A hammer sitting on a support level you drew yesterday tells a story: buyers defended a price that already mattered. The same hammer in empty space means very little. See support and resistance that hold for how to mark levels first.
3. The higher timeframe does not oppose it
A bullish pattern on the 1-hour chart that forms inside a steep daily downtrend is a small pause in a bigger fall. Patterns that agree with the higher timeframe have more room to run. Read multi-timeframe analysis for the routine.
4. A trigger candle confirms it
Many patterns fail on the very next candle. A conservative approach is to wait for a trigger: for a hammer, a later candle that closes above the hammer's high. You lose some of the move by waiting. In return, you filter out a share of the failures.
5. The stop and the size work
The pattern gives you a natural place for the stop loss (an order that closes the position at a set price): beyond the extreme of the pattern. If that distance would force a lot size (the volume of a position) below your broker's minimum, or a risk above your limit, there is no trade.
Same candle, different odds. The hammer on a marked level has a story. The hammer in open space does not.
A worked example: the stop sets the size
Say EUR/USD has fallen for several days into a daily support zone you marked last week. A hammer forms, and the next candle closes above its high. That is a level, a prior fall and a trigger. Now the stop and the size.
The hammer's low sits 30 pips below your entry. A pip is the smallest standard price step, 0.0001 on EUR/USD. You put the stop loss just beyond the low. On the site's shared $2,400 account, 1% risk is $24.
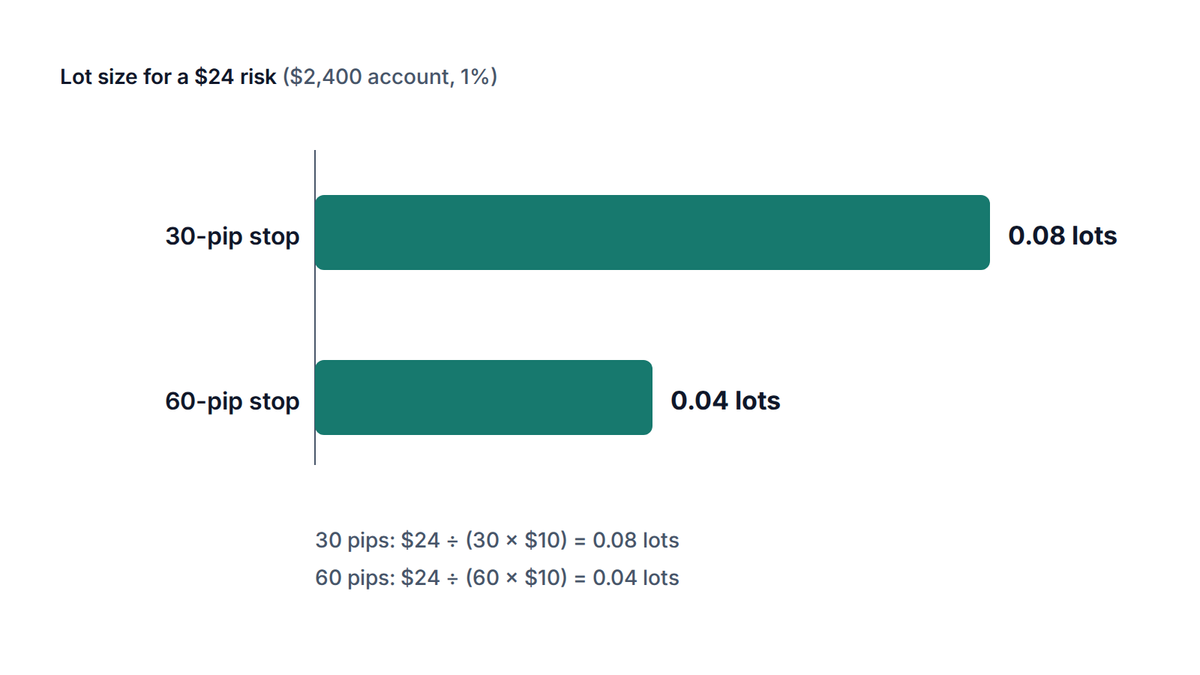
One standard lot (100,000 units of the base currency) moves about $10 per pip on EUR/USD. So $24 divided by 30 pips at $10 per pip gives 0.08 lots, with a loss of $24 if the stop is hit. The calculation is the same one the lot size calculator runs.
Now suppose the hammer had a longer wick and the stop distance is 60 pips instead. The same $24 risk gives 0.04 lots, half the size. The wider the pattern, the smaller the position. The risk stays at $24 either way, which is the point.
The same $24 of risk buys half as many lots when the stop is twice as far away.
Try it now
Run your own stop distance through the calculator before you place a trade.
The same logic applies on gold. A $12 stop on XAU/USD with the same $24 risk gives 0.02 lots, because one standard lot moves about $100 per $1 of price. For the full routine, see how to size a position on gold.
Why reversal patterns fail
Even a pattern in the right place fails often. Candles form inside a market that is driven by news, order flow and other traders who may be on a different timeframe. Your hammer is somebody else's pause.
Trends persist. A fall can print three hammers on the way down before it stops. Each one looked fine in isolation.
Timeframe noise. On a 1-minute chart, patterns form constantly, so most of them mean nothing. Higher timeframes give fewer and more meaningful ones.
Hindsight. Looking back at a chart, you only notice the patterns that worked. The failures fade from memory.
Subjectivity. One trader's engulfing candle is another's inside bar. Without fixed rules, you will see what you want to see.
None of this means ignore candles. It means treat a pattern as one input among several, and accept that a good process still loses often. Judge it over many trades, not one.
Risk note
A candlestick pattern is not a signal and nothing here is a trade recommendation. Leveraged products can lose money quickly, so test any routine on a demo account first.
A short routine for any reversal pattern
Mark your levels before you look for patterns, not after.
Note the prior move: is there a clear run into the level?
Check the next timeframe up. Does it oppose the idea?
Wait for the pattern and a trigger candle close.
Place the stop loss beyond the pattern's extreme, then compute the lot size from that distance.
If the lot size is below the minimum or the risk is above your limit, skip it.
Writing the routine down turns a vague feeling into a repeatable check. It also gives you something to review later, which is how you find out whether a pattern works for you.
Frequently asked questions
What are the most reliable reversal candlestick patterns?
No pattern is reliable on its own. The hammer, shooting star, engulfing, morning star and evening star are the most widely used. Their usefulness depends on where they form, so judge them by context rather than by name.
How do I tell a bullish reversal from a pause in a downtrend?
Look for a marked support level, a clear prior fall, agreement from the higher timeframe and a trigger candle that closes above the pattern's high. If several of these are missing, assume it is a pause.
Do candlestick reversal patterns work on every timeframe?
They form on every timeframe, but they carry more weight on higher ones such as the 4-hour and daily charts. On very short timeframes they appear so often that most are noise.
Should I trade a reversal pattern without confirmation?
Many traders wait for a trigger candle because many patterns fail on the next bar. Waiting costs part of the move and removes some of the failures. Either way, set the stop first and size from it.
◆
The PipsMorrow Team
A team of writers covering XAU/USD gold trading education. We focus on explaining the mechanics and risk management in a structured way, with no trade signals and no promotion of any specific broker.
A candlestick patterns cheat sheet with 12 bullish and bearish patterns, plus the context each one needs before it means anything. Save the grid and use it.
Gold support and resistance at gold's own scale: size zones from ATR, score each XAU/USD level with five checks, then set the stop and lot size from it.