
Technical analysis
Moving Average Crossover: What It Catches and Misses
A moving average crossover signals a trend change late by design. See what it catches, what it misses, why it lags and how to test your settings.
11 min read
Read more →
Backtesting trading strategies means replaying rules on old charts. Learn how to do it step by step and avoid the traps that make a weak system look strong.
Backtesting trading strategies means taking a fixed set of rules and replaying them on past price data to see what they would have done. Done well, it is the cheapest way to find out whether an idea deserves real money. Done badly, it produces a lovely equity curve that disappears the day you go live.
This article answers what backtesting in trading is, then walks through how to backtest a trading strategy in six steps. It spends most of its time on the ways a test lies to you, because those are what separate a useful result from a flattering one.
A backtest is a simulation. You write down exactly when a strategy enters, where it places the stop loss (the price where the idea is proven wrong), where it takes profit, and how large each position is. Then you apply those rules to old charts, one candle at a time, and log what would have happened.
The output is a list of trades. From that list you can compute the win rate, the average win and loss, the expectancy (average result per trade) and the worst drawdown (the fall from a peak in your balance to the next low). If those words are new, the lesson on the metrics that actually matter defines each one.
There are two ways to do it. In a manual backtest you scroll a chart forward candle by candle and note each trade by hand. In an automated backtest a program applies coded rules to the whole history in seconds. Manual testing is slow but forces you to see each setup. Automated testing is fast but only as honest as the code. The method below works for both.
One limit to keep in mind from the start. A backtest tests the rules, not you. It cannot show how you would feel during a ten-trade losing run, and it cannot tell you whether the future will resemble the past. It can only tell you whether the idea was ever worth taking seriously.
The order matters. Most self-deception comes from doing the steps out of sequence, usually by looking at results before the rules are fixed.
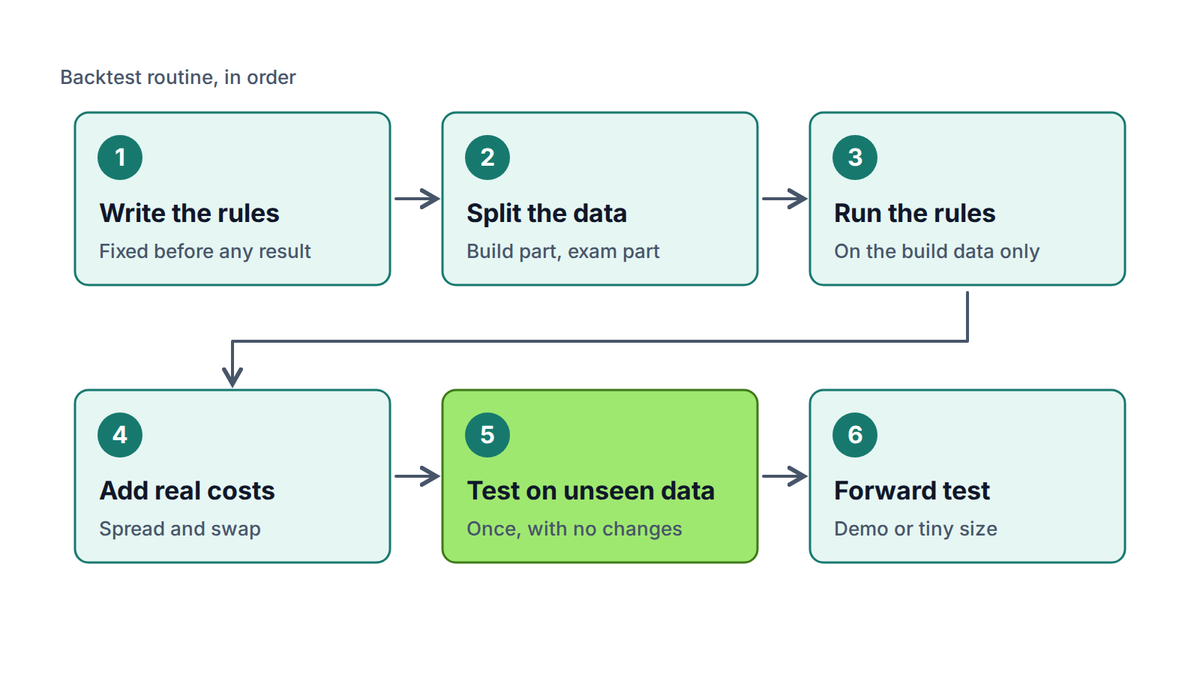
Steps 2 and 5 are the ones people skip, and they are the ones that protect you. Without them, you are marking your own homework.
Imagine a student who is given the exam questions to study from. A perfect score proves nothing. A backtest run and tuned on the same data is the same: you will always find settings that fit the past.
The fix is to divide history into two blocks. The in-sample block is where you build and adjust. The out-of-sample block is the exam: you run on it once, with no changes afterward. If you change the rules after seeing the exam result, the exam is spent and you need fresh data.
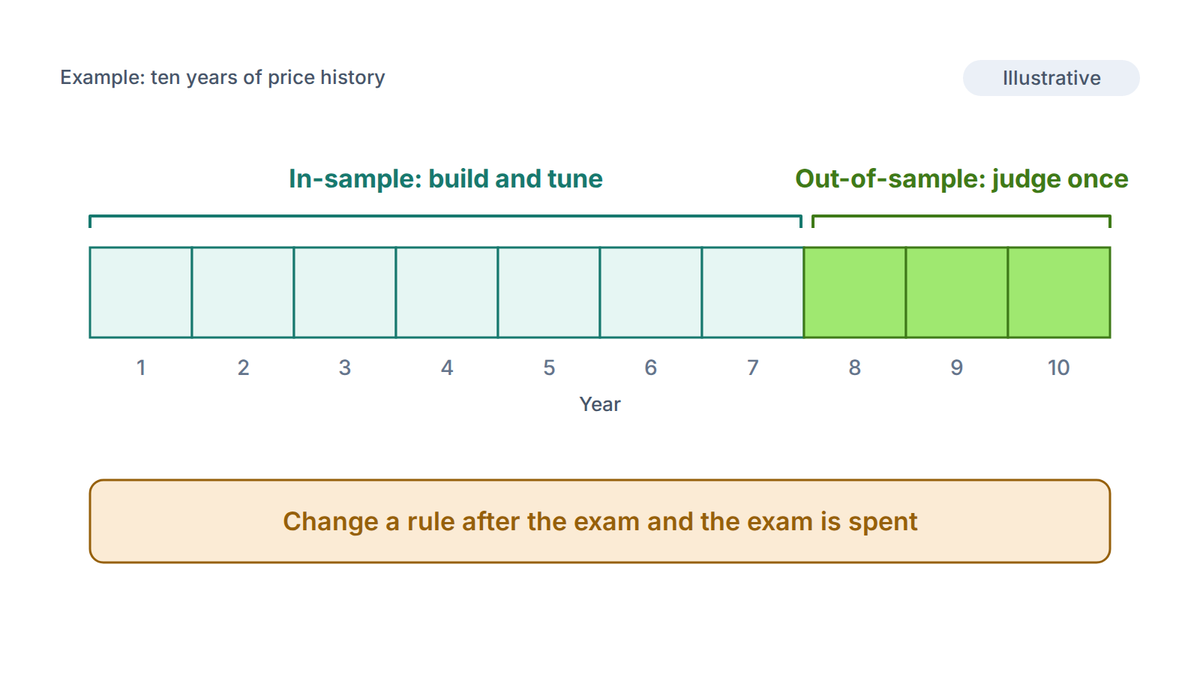
A stricter version is walk-forward testing. You build on a window, test on the next stretch, slide both windows forward and repeat. Every test period is data the rules never touched, and you see whether the result holds across several market conditions instead of one.
Whichever way you split, include different conditions. A system tested only on a long, calm uptrend has not been tested at all against a range or a sudden reversal. Make sure both blocks contain trending, ranging and fast-moving stretches.
Suppose you try 20 variations of an idea: different moving average lengths, different stop sizes, different sessions. You then keep the best. That feels like research. Statistically it is a lottery in which you only show the winning ticket.
Here is a clean way to see it. Take 20 strategies that flip a coin for every trade, each with a 1:1 payoff and a true win rate of exactly 50%. Run each for 100 trades. None has any edge. Yet the best of the 20 will usually look good.
| Result over 100 trades | One strategy reaches it | Best of 20 reaches it |
|---|---|---|
| 55 wins or more | 18.4% | 98.3% |
| 58 wins or more | 6.7% | 74.8% |
| 60 wins or more | 2.8% | 43.8% |
| 62 wins or more | 1.1% | 19.0% |
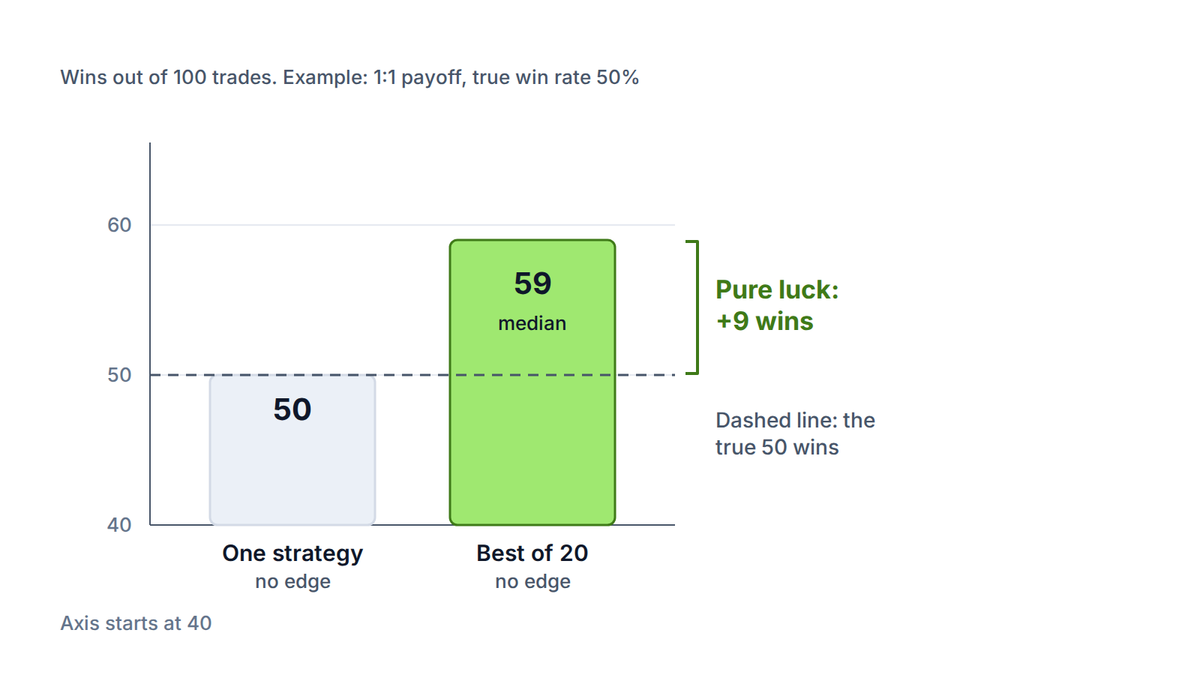
A 59% win rate at 1:1 is a +0.18R expectancy, which would look excellent in a report. It came from nothing. The same thing happens, more quietly, every time you nudge a setting and re-run the test until the curve looks smooth.
This is overfitting, sometimes called curve fitting: the rules have learned the noise of one data set. Count your tries, because each one raises the bar the final result has to clear. The lesson on over-optimization and curve fitting goes deeper, and the cure is the out-of-sample test above.
Signs a result is overfit
Be suspicious when tiny changes to a setting swing the result a lot, when the rules have many parameters for a small number of trades, or when the best settings sit alone with poor neighbors. A real edge usually survives small changes to the numbers.
Even an honest test is noisy if it is short. Each trade is a coin flip with a payoff, so the average of a few trades jumps around. The uncertainty shrinks slowly, with the square root of the number of trades.
What each variable means:
| Trades in the test | Expectancy could be off by about | In dollars at $24 risk |
|---|---|---|
| 30 | ±0.36R | ±$8.60 per trade |
| 100 | ±0.20R | ±$4.70 per trade |
| 400 | ±0.10R | ±$2.35 per trade |
Read the middle row. A system that shows +0.08R over 100 trades is inside the noise, because the true figure could sit anywhere from about −0.12R to +0.28R. Treat 100 trades as a minimum for a first look and several hundred as the target. If the strategy rarely trades, you need more years of data, not a looser rule.
You can test how a result behaves under a losing run with the risk of ruin calculator and the drawdown calculator. Both take the win rate and the payoff your backtest produced.
A frictionless backtest assumes you buy and sell at the middle price with no fee. Real trades pay the spread on entry, and often a commission and a swap on top. These costs are fixed in dollars, so they hurt most when your stop is small.
Take a gold (XAU/USD) system with a $3.00 stop, a 1:1 target and a 54% win rate. Gross, it earns 0.54 − 0.46 = +0.08R per trade. Now add a 30-cent spread. That is $0.30 ÷ $3.00 = 0.10R lost on every trade, win or lose.
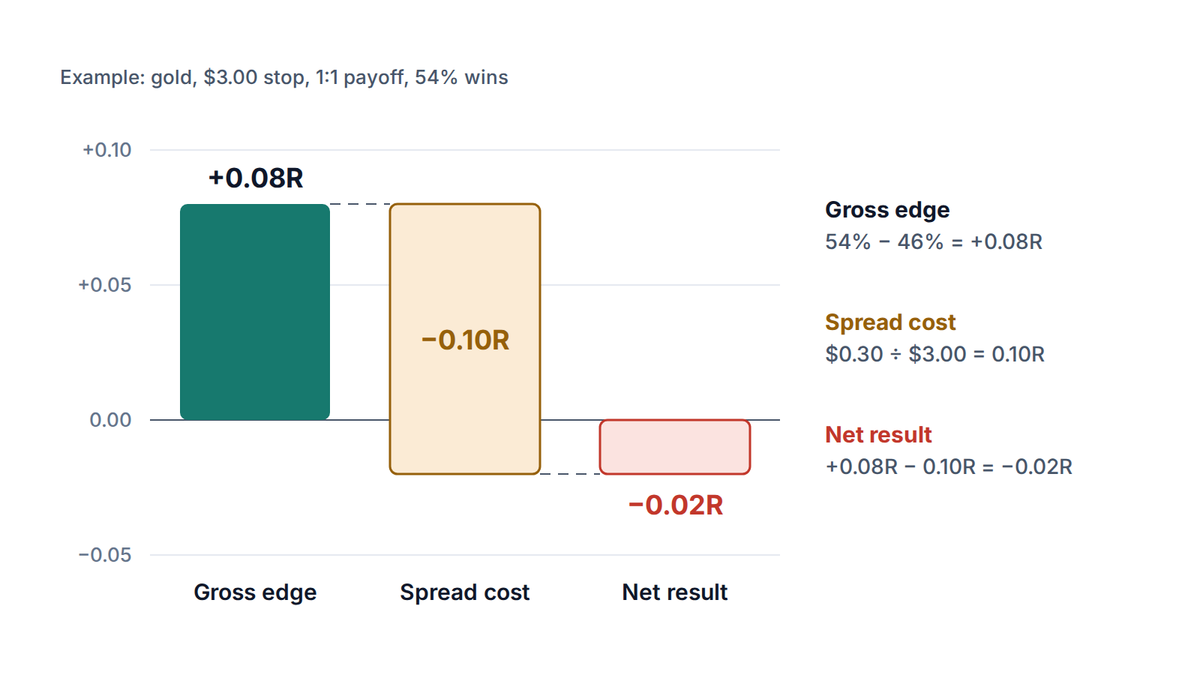
On the $2,400 account at 1% risk, one R is $24. Over 200 trades the gross edge is worth +0.08 × $24 × 200 = $384, and the spread costs 0.10 × $24 × 200 = $480. The system loses $96 while looking profitable on the chart.
So put costs in as a rule, not an afterthought. Use a spread at least as wide as you see live, and a wider one for news hours, when spreads widen. What is spread in forex explains how it behaves, and the profit and loss calculator lets you check what a trade nets after costs.
Data quality matters too. Free historical data can have gaps or wrong spreads. If a result depends on a few odd candles, check them against a second source before you believe it.
Suppose your rules pass the out-of-sample test with costs in. That earns a promotion, not a launch. Forward test next: trade the rules on a demo account or at a tiny size for at least 50 trades, and compare the live numbers with the backtest. Execution, slippage and your own hesitation all show up here.
Set a fail condition before you start, for example: stop and review if the live expectancy is more than 0.2R below the backtest after 100 trades, or if drawdown exceeds the worst figure in the test by half. Then log every trade in a journal so the comparison is honest. Keep sizing rules in line with how to size a position.
A backtest is not a forecast
Markets change. A pattern that worked in one decade of rates and volatility can fade in the next. Even a clean test only shows the rules were sound in that period. Trade small, expect the live result to be worse than the test, and never risk money you cannot afford to lose.
It is replaying fixed trading rules on historical price data to see what they would have earned. You log each simulated trade and compute metrics such as win rate, expectancy and drawdown. It shows whether an idea had an edge in the past, not that it will in the future.
Hide the right side of a chart, then scroll forward one candle at a time. Apply your written rules, record each entry, stop, exit and result in R, and never skip a setup in hindsight. A spreadsheet is enough. Aim for at least 100 trades before you read anything into the totals.
There is no magic number, but 30 trades is far too few and 100 is a bare minimum. At 100 trades the expectancy is uncertain by roughly ±0.20R, so several hundred is better. Strategies that trade rarely need more years of data to get there.
A backtest uses past data you already have, so the outcome is known and rules can be tuned against it. A forward test runs the same rules on live prices as they arrive, on demo or at small size. It checks execution and costs that a backtest can only assume.
Yes, and it often does. Overfitting, missing costs, look-ahead bias and a changed market are the usual causes. Splitting your data, adding realistic spreads, and forward testing before sizing up remove most of them, though none removes the risk.
The PipsMorrow Team
A team of writers covering XAU/USD gold trading education. We focus on explaining the mechanics and risk management in a structured way, with no trade signals and no promotion of any specific broker.
Last updated
A moving average crossover signals a trend change late by design. See what it catches, what it misses, why it lags and how to test your settings.
11 min read
Read more →Trading expectancy is what a strategy earns per trade on average. See how a 35% win rate can pay while a 70% win rate loses, with worked examples in R.
11 min read
Read more →A forex expert advisor is a program that trades your written rules on MT5. See what it automates, what it cannot judge, and where automated strategies fail.
11 min read
Read more →Build on this article with the full gold trading curriculum, ordered from the basics to advanced topics, free.

