
Tools
What Is Drawdown in Trading? How to Measure and Recover
What is drawdown in trading? It is the fall from an account's peak to its next low. Learn to measure it and why a 50% loss needs a 100% gain to recover.
10 min read
Read more →
Compounding trading means each period's gain is added to the balance that earns the next. See the math on a $2,400 account, and the risks it leaves out.
Compounding trading means letting each period's result join your balance, so the next period's percentage is earned on a larger number. If you are asking what is compounding in trading, it is the same math as interest on interest, applied to a trading account instead of a savings account.
The math is real and easy to run. The trouble is that spreadsheets assume smooth returns, and trading is not smooth. This guide works through a $2,400 account, shows what compounding adds, and then covers what the neat curve leaves out. It is education, not a forecast or a suggestion to place any trade.
Compounding meaning in trading is simple: you do not withdraw your profit, and you size your next trades from the new, larger balance. A $2,400 account that gains 2% finishes the month at $2,448. The next 2% is earned on $2,448, not on $2,400.
What each variable means:
Without compounding, you earn the same dollar amount each period. That is called simple growth. At 2% of $2,400, simple growth adds $48 every month, so 12 months adds $576 for a $2,976 balance.
Compounding works both ways
The same logic applies to losses. When you lose, the next trade is sized from a smaller balance, so the dollar risk shrinks. Compounding is a rule about arithmetic, not a promise about results.
In live trading it appears through position size. If you risk 1% per trade, that is $24 on a $2,400 account and $28.80 once the account reaches $2,880. Your lot size (the trade volume, where one standard lot is 100,000 units of the base currency) rises with the balance, so profits feed back into the next trades. The guide to sizing a position shows the lot-size step.
Here is the same account at four different monthly gains over 12 months. Every number comes from the site's compounding calculator, and the simple column adds the same percentage of the starting balance each month.
| Gain per month | Simple growth | Compounded | Extra from compounding |
|---|---|---|---|
| 1% | $2,688.00 | $2,704.38 | $16.38 |
| 2% | $2,976.00 | $3,043.78 | $67.78 |
| 3% | $3,264.00 | $3,421.83 | $157.83 |
| 5% | $3,840.00 | $4,310.06 | $470.06 |
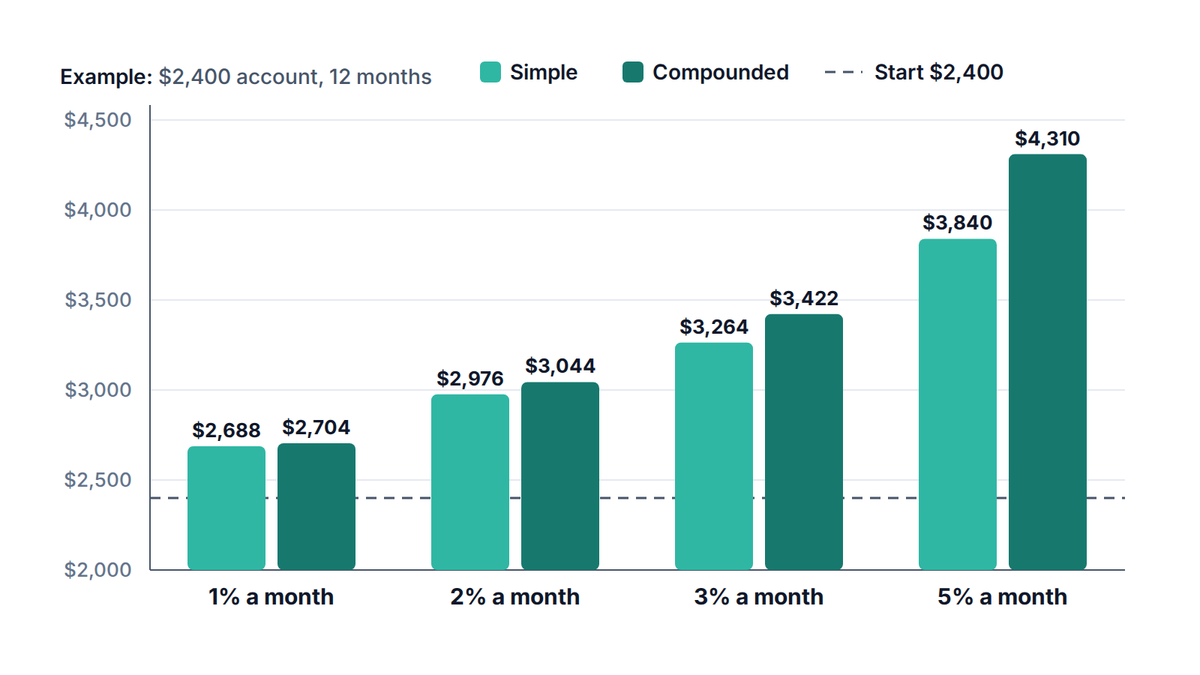
Notice how modest the first year looks. Compounding is slow at the start and larger later, because the extra comes from gains earning gains. At 2% a month, the 12th month adds $59.68 to the balance, against $48 in the first.
Stretch the same 2% a month to 120 months and the calculator returns $25,836.39 from $2,400. That is a gain of about 977%. It looks like a plan, but it is only the formula, run for ten years with no bad month in it.
Few traders hold a flat 2% a month for even one year, let alone ten. Projections like this say nothing about a trading edge. They only show what a number would do if it were true. The next section shows what happens when it is not steady.
A compounding table assumes the same gain every period. Real results swing. The swings matter because compounding multiplies, and multiplying a gain and a loss does not give back the average.
Take two paths with the same average. The steady path earns +2% each month. The bumpy path alternates +12% and −8%, which also averages +2% a month. Both start at $2,400 and run 12 months.
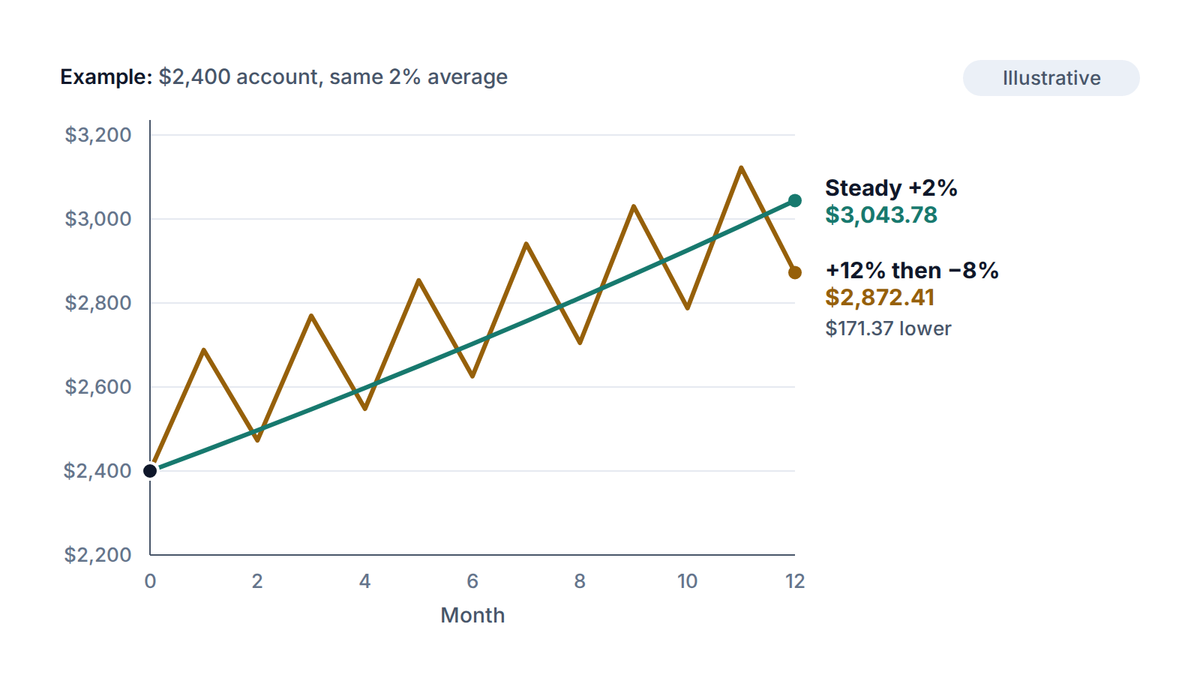
This is sometimes called volatility drag (the lost growth that comes from swings). The bigger the swings, the bigger the drag. A calculator that asks for one gain figure cannot show it, which is why you should run the number again with a bad month in it.
A drawdown (the fall from a peak balance) compounds in the wrong direction. If you lose 20%, you hold 80% of the balance, and getting back to 100% takes a 25% gain on what is left. The math is gain needed = loss ÷ (100% − loss).
| Loss from peak | Gain needed to recover |
|---|---|
| 10% | 11.1% |
| 20% | 25.0% |
| 33% | 49.3% |
| 50% | 100.0% |
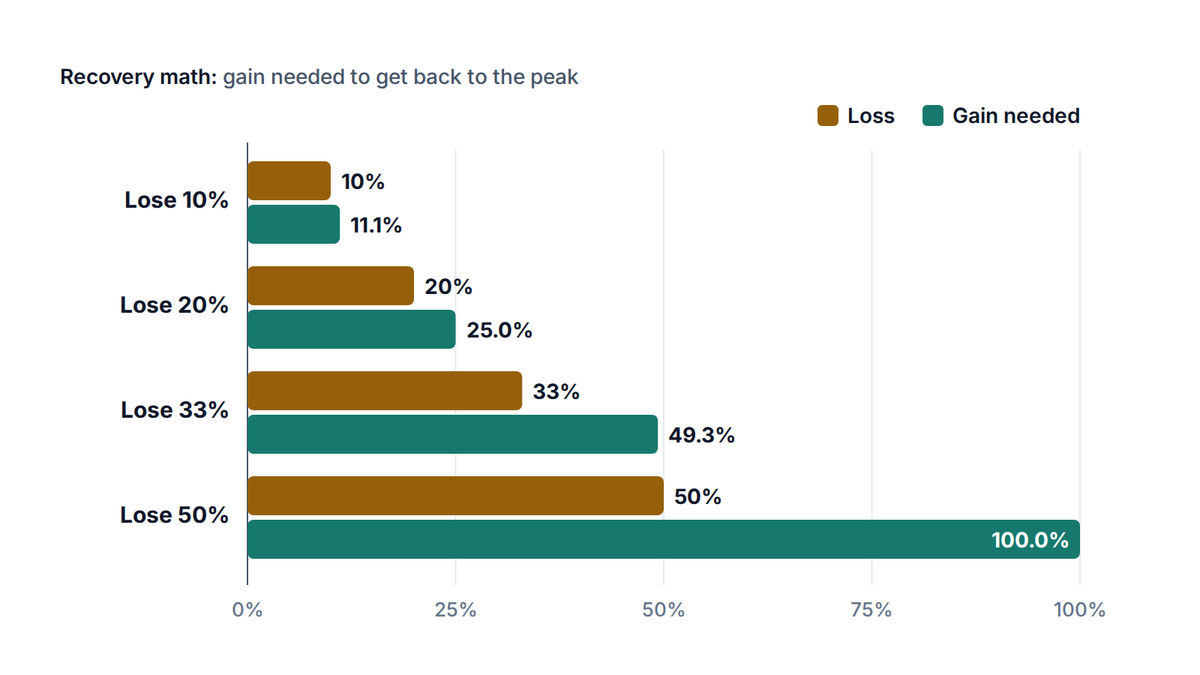
For a closer look at how a falling account behaves, read the guide to drawdown in trading. You can also replay your own numbers in the drawdown calculator.
Go back to the steady 2% path and replace month 6 with a −10% month. The other eleven months stay at +2%. The account ends at $2,685.69 instead of $3,043.78, a difference of $358.09 from a single month.
Even a smooth return series hides costs and limits. When you use a table for planning, add the pieces below before trusting it.
Above all, a monthly gain is an outcome, not a setting. You can choose your risk per trade, but you cannot choose your return. That is why risk control comes before the compounding talk in any sound plan.
Compounding is useful when you treat it as a rule for sizing, not as a target. Fixed-percentage risk compounds on its own: the dollar amount rises after wins and falls after losses.
A table is not a target
Setting a goal such as 5% a month and chasing it often leads to larger risk after losses. Pick risk first and let the result follow. A plan built on a return number invites over-trading.
The risk of ruin calculator pairs well with this: it shows how likely a losing streak is to hurt a plan at a given risk level, which a compounding table never will.
Try it now
Enter a starting balance, the number of periods and a gain per period. The calculator returns the ending balance, the total profit and a row for each period, so you can compare it with simple growth.
If you are searching for a trading compounding calculator, this is the one to use. Try it twice: once with your hoped-for gain, then again with a lower figure, to see how much of any result rests on an assumption.
It is adding your profits to your balance so that later trades are sized, and later percentages earned, on a larger amount. The formula is start × (1 + gain)^periods. It also works in reverse after losses.
Gains earn gains. If $2,400 grows 2% to $2,448, the next 2% is calculated on $2,448. Over many periods the extra from that effect adds up, but only if the gains actually arrive.
Not on its own. In the first year the effect is small: at 2% a month, $2,400 compounds to $3,043.78 against $2,976 for simple growth. Compounding magnifies a result you already have, and cannot create one.
Enter your balance, a number of periods and a gain per period, then read the ending balance. Treat the answer as a what-if, and rerun it with lower gains and a losing period to see how fragile the number is.
The PipsMorrow Team
A team of writers covering XAU/USD gold trading education. We focus on explaining the mechanics and risk management in a structured way, with no trade signals and no promotion of any specific broker.
Last updated
What is drawdown in trading? It is the fall from an account's peak to its next low. Learn to measure it and why a 50% loss needs a 100% gain to recover.
10 min read
Read more →Trailing drawdown is a loss limit that rises with your best balance. See how end-of-day and intraday trailing differ, with worked numbers on a $50,000 account.
10 min read
Read more →What is a margin call? It is your broker's warning that equity is close to the margin held. See the numbers, the stop out that follows and how to avoid both.
10 min read
Read more →Build on this article with the full gold trading curriculum, ordered from the basics to advanced topics, free.

