
Fundamentals
Forex Correlation: Avoid Placing the Same Trade 3 Times
Forex correlation shows how currency pairs move together. Learn to read it, spot hidden duplicate trades and cap your combined risk on a $2,400 account.
9 min read
Read more →
The correlation between DXY and gold is usually negative but far from fixed. Learn why, how to read a DXY vs gold chart, and how to size trades around it.
The correlation between DXY and gold is one of the first relationships gold traders learn: when the US dollar rises, gold tends to fall, and the reverse. It is a useful tendency. It is also a poor rule, because the link weakens, flips and sometimes vanishes for months.
This article explains what the dollar index measures, why gold usually moves against it, and how to read a DXY vs gold chart without fooling yourself. It ends with a way to size a gold trade when the dollar is the main story.
DXY is the US Dollar Index. It tracks the dollar against a fixed basket of six currencies. The Federal Reserve created it in March 1973 with a base value of 100, and ICE (Intercontinental Exchange) now runs it and lists futures on it.
A reading above 100 means the dollar is worth more against the basket than it was at the base date. A move from 100.00 to 101.00 is a rise of 1% in the dollar's basket value. The index has no units and no price you can pay for directly.
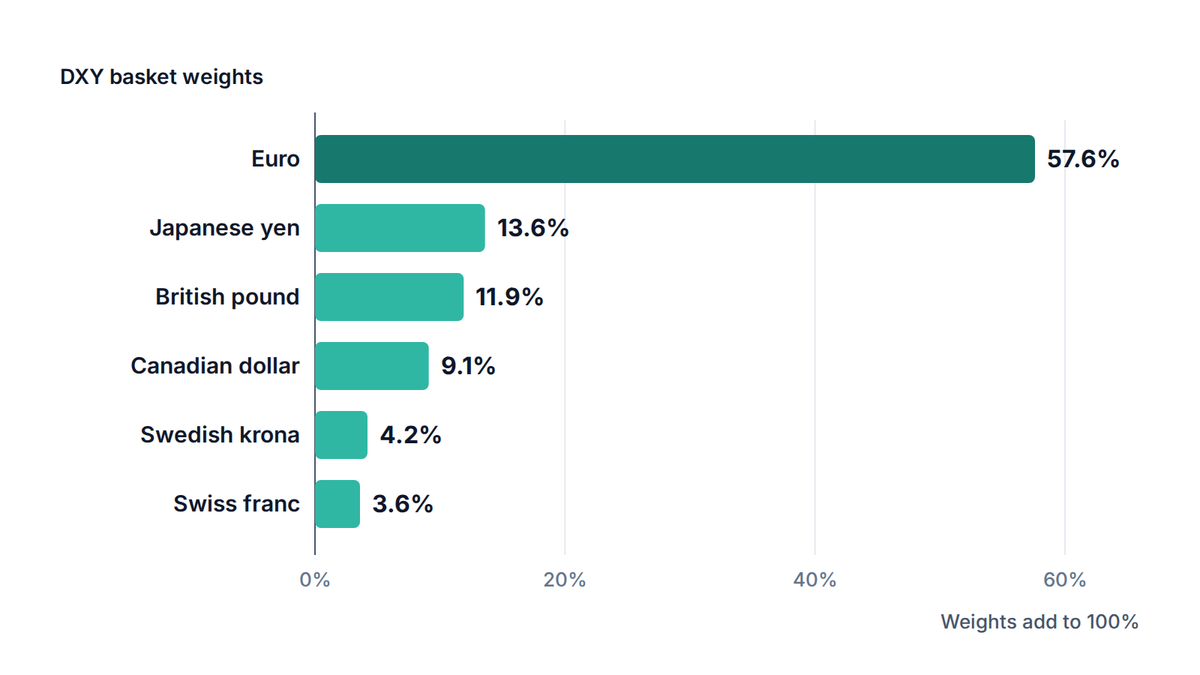
The weights are the part many new traders miss. The euro is 57.6%, the yen 13.6%, the pound 11.9%, the Canadian dollar 9.1%, the Swedish krona 4.2% and the Swiss franc 3.6%. The index has not added currencies such as the Chinese yuan or the Mexican peso.
So DXY is not the dollar against the world. It is mainly the dollar against the euro, with a few others along for the ride. If EUR/USD drops, DXY almost always rises. The article on forex correlation covers why pairs sharing a currency move together.
The point to keep: DXY is a handy gauge of dollar mood, but it is a euro-heavy one.
Gold is quoted as XAU/USD, which is the price of one troy ounce (31.1035 g) in US dollars. That quote is the root of the link. A stronger dollar means the same dollar price costs more in euros, yen or pounds.
Higher cost for foreign buyers can trim demand. A weaker dollar does the opposite and can lift it. This is the currency channel, and it is the simplest reason for a negative correlation (a statistical link where one series tends to rise as the other falls).
Two other channels often run in the same direction. Rising US interest rates tend to lift the dollar and raise the return gold holders give up, as the article on gold price vs interest rates explains. And investors often treat both gold and the dollar as shelters, so each can respond to the same news.
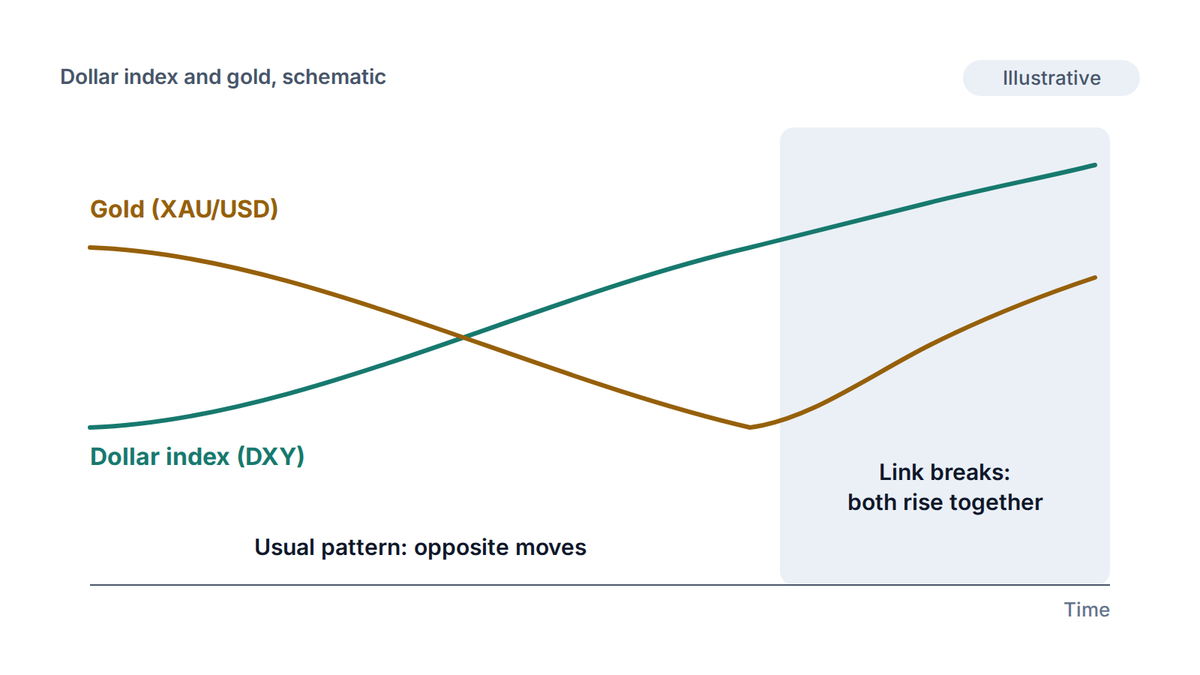
Each channel is a tendency, not a mechanism that must fire. That is why the reading on a chart keeps changing, which brings us to the number itself.
A correlation coefficient runs from -1 to +1. At -1 the two series move in exact opposite directions. At +1 they move together. At 0 there is no consistent link. Real markets sit somewhere in between, and the figure depends on the window you measure.
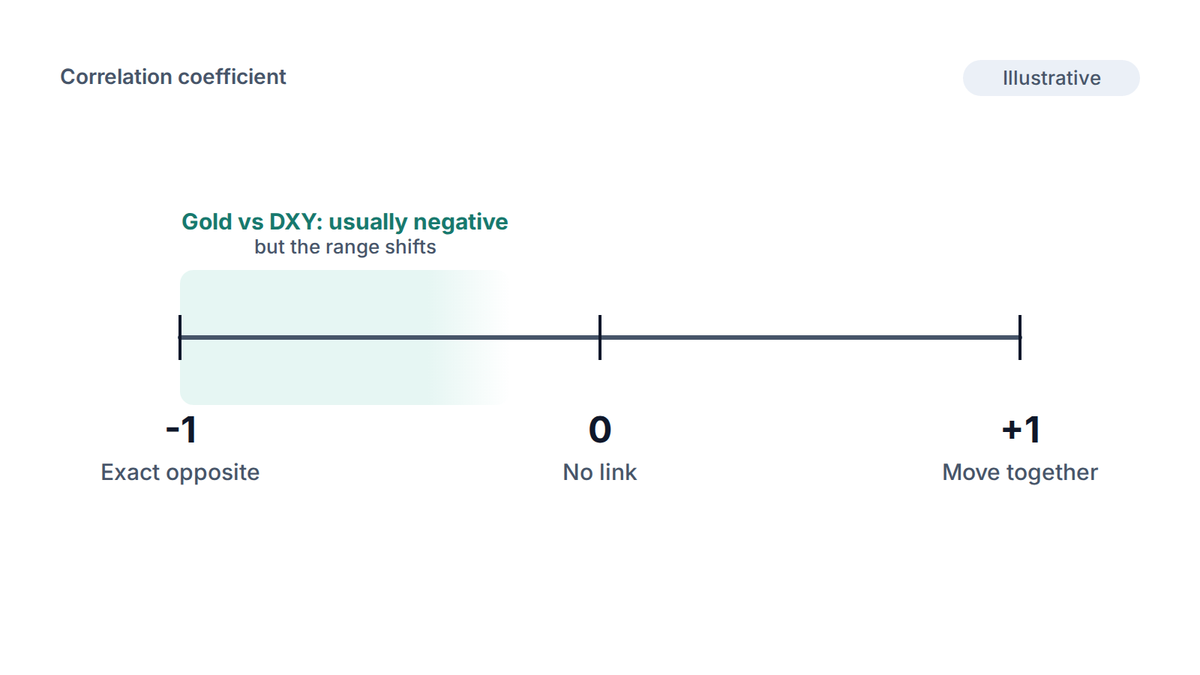
Three details matter in practice. First, the window: a 20-day reading, a 90-day reading and a 5-year reading can disagree sharply. Second, the data frequency: daily changes give a different answer than weekly ones. Third, a rolling correlation (one recalculated over a sliding window) shows the drift that a single number hides.
You can see this on any charting platform. Plot DXY and XAU/USD in separate panes or overlay one inverted, then add a correlation indicator if your platform has one. Do not trust a figure quoted in an article, including this one, without checking the dates behind it.
| Reading | What it suggests | How a trader might use it |
|---|---|---|
| Near -0.8 or lower | Strong inverse link in this window | Treat a DXY move as useful context for gold |
| About -0.3 to -0.5 | Weak inverse link | Dollar is one driver among several |
| Near 0 | No usable link right now | Look at other drivers, such as yields |
| Above 0 | Link has flipped in this window | Do not assume gold will fall when DXY rises |
The lesson here is plain: a correlation is a description of a past window, not a promise about the next one.
Gold and the dollar have risen together more than once. A global scare can send money into both at once, and the price of gold can climb even as DXY firms. Heavy buying by central banks adds a floor that has nothing to do with the dollar.
The article on institutional gold demand shows why official buyers care about reserves, not currency strength. Their orders can hold gold up while the dollar rises.
Another break comes from the index itself. Because the euro is 57.6% of DXY, a euro-specific story can move DXY while the dollar is little changed against the yen or the pound. Gold, priced against the dollar broadly, may not react.
A check, not a conclusion
If gold and DXY have both risen for several sessions, ask what else is happening before calling it a mistake. A shift like that usually means a different driver has taken over.
So treat the pair as a hypothesis you re-test: when DXY and gold stop mirroring each other, a new driver has probably arrived.
The dollar moves most around US data and Fed decisions. Most releases land at 8:30 a.m. New York time, which is 12:30 UTC in US summer and 13:30 UTC in winter. The article on gold and the FOMC covers the biggest of these events.
On those days gold can swing with the dollar in minutes. A tight stop gets hit by noise. The honest response is to widen the stop and cut the lot size so the money at risk stays fixed.
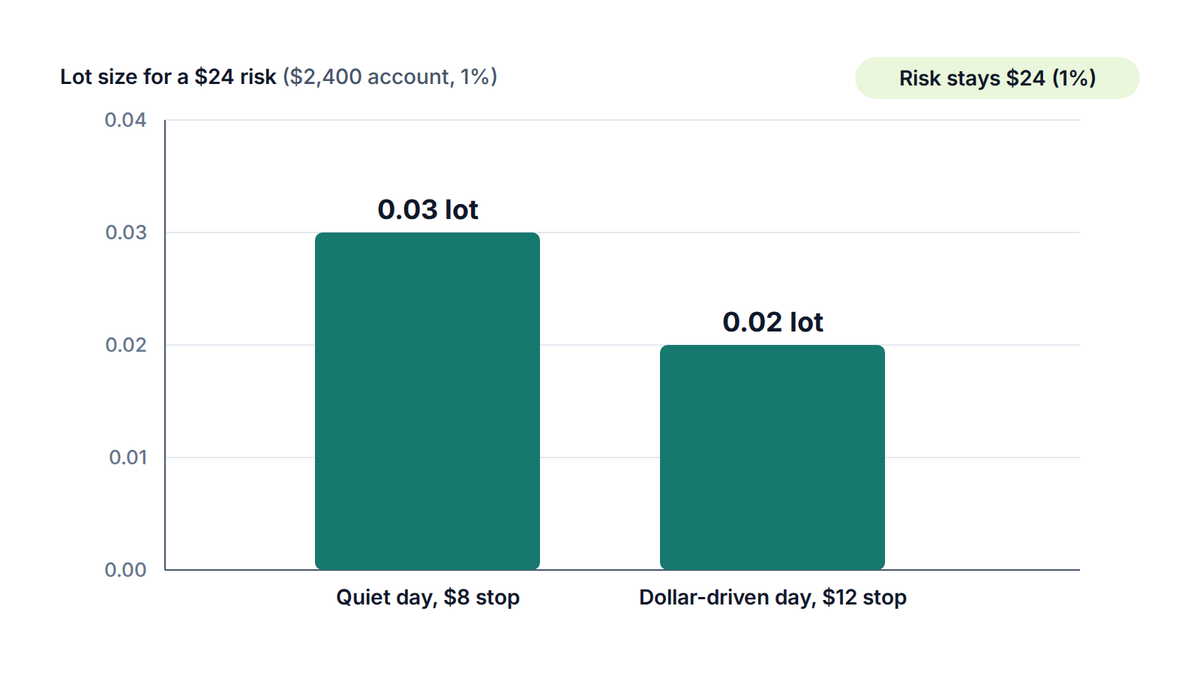
Take a $2,400 account risking 1% per trade, which is $24. One standard lot of XAU/USD is 100 troy ounces, so a $1 move is $100 per lot. On a quiet day you might use an $8 stop, which the lot size calculator turns into 0.03 lot.
On a day when DXY is reacting to a jobs report, you might need a $12 stop to survive the swings. The same $24 risk now allows only 0.02 lot. The risk in dollars is unchanged, and the position is smaller.
Try it now
Enter your balance, your risk percentage and the stop you need on a data day. If the result is below 0.01 lot, skip the trade.
There is also a hidden-risk angle. A long XAU/USD trade and a long EUR/USD trade both profit from a weaker dollar. Two 1% risks can behave like one 2% risk on a single idea. The lesson on correlated exposure shows how to count it.
Risk warning
Leverage (using borrowed exposure so a small deposit controls a large position) magnifies gold's moves in both directions. Prices can gap past your stop around data releases. CFDs (contracts for difference) can lose you more than you planned, so practice on a demo account first.
You do not need to trade the dollar to use it. A short routine keeps DXY in your gold analysis without letting it make the decision. The lesson on what moves the gold price puts the dollar in context with the other drivers.
Keep three cautions in mind:
The habit to build is simple: use DXY as context for gold, then let your own price levels and risk rules decide.
Usually, but not always. Gold is priced in dollars, so a stronger dollar tends to weigh on it. The relationship changes by period and has turned positive at times, so measure it over the window you trade.
It depends on the window and the data frequency, so no single figure holds for long. Plot a rolling correlation on your charting platform and read the latest values with their dates.
It shows the dollar index and XAU/USD on the same time axis. Many traders invert one of the two so that the mirror-image moves line up. Divergences, where both rise or fall together, are the useful part.
A scare can send money into both at once, and central bank buying can support gold regardless of the dollar. DXY can also rise for euro-specific reasons that do not affect gold.
That is risky. DXY is one driver, and the link can break without warning. Combine it with price levels, a stop loss and position sizing, and test any idea on a demo account first.
The PipsMorrow Team
A team of writers covering XAU/USD gold trading education. We focus on explaining the mechanics and risk management in a structured way, with no trade signals and no promotion of any specific broker.
Last updated
Forex correlation shows how currency pairs move together. Learn to read it, spot hidden duplicate trades and cap your combined risk on a $2,400 account.
9 min read
Read more →Gold price vs interest rates: why the real yield, not the headline rate, drives gold, where that link broke after 2022, and how to size trades around it.
10 min read
Read more →How to add XAUUSD to MT5 through Market Watch, read its specification, and decode suffixes like XAUUSD.m so you pick the right gold symbol.
7 min read
Read more →Build on this article with the full gold trading curriculum, ordered from the basics to advanced topics, free.

