
Gold
Correlation Between DXY and Gold: How They Move Together
The correlation between DXY and gold is usually negative but far from fixed. Learn why, how to read a DXY vs gold chart, and how to size trades around it.
9 min read
Read more →
Forex correlation shows how currency pairs move together. Learn to read it, spot hidden duplicate trades and cap your combined risk on a $2,400 account.
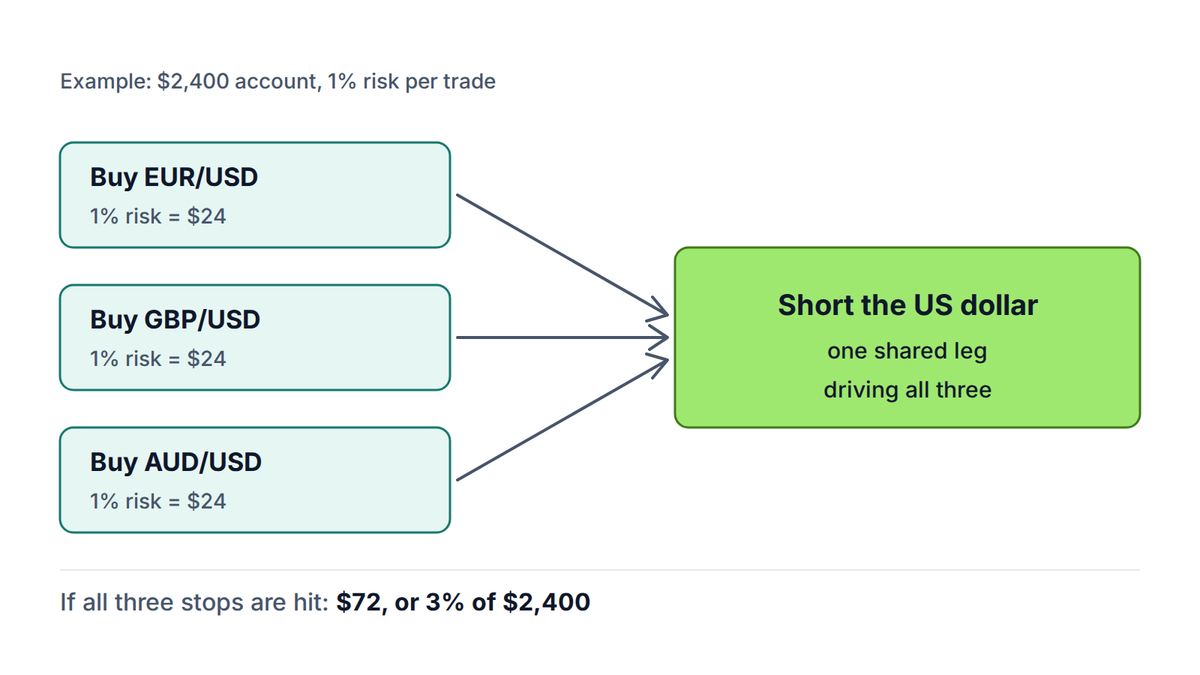
You buy EUR/USD, then GBP/USD, then AUD/USD. Three charts, three setups, three tickets on the platform. But if all three are really a bet that the US dollar will fall, you have placed the same trade three times. That is what forex correlation is about.
This article explains what currency correlation means, how to read a forex correlation table, and why some pairs move together while others move in opposite directions. Then it turns the idea into a simple rule for capping your risk, with numbers from the site's shared $2,400 account.
Forex correlation describes how two currency pairs move relative to each other over a period of time. It is a number called the correlation coefficient. It runs from −1 to +1, and each end and the middle tell you something different.
Real pairs almost never hit the extremes. You will see numbers such as +0.85, +0.3 or −0.7. The closer a number sits to either end, the more the two pairs behave like one position. The closer to zero, the more independent they are.
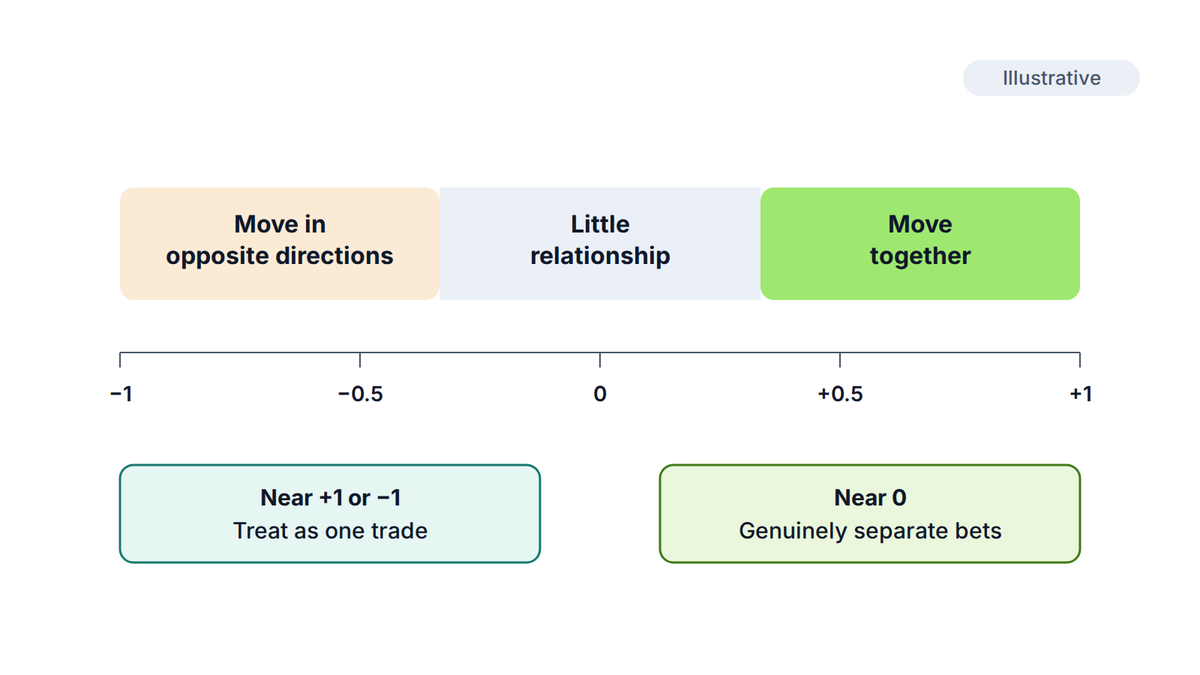
Correlation says nothing about cause. Two pairs can move together because they share a currency, because the same news drives both, or by coincidence over a short window. Understanding the reason matters more than the number, because the reason tells you when the link might break.
How the number is calculated
The coefficient compares the changes in two prices over the same stretch of candles, such as 60 daily closes. Charting platforms and free correlation tools calculate it for you. You only need to know which window it covers.
Every forex position is two bets in one. Buying EUR/USD means you are long the euro and short the US dollar. That is why the pairs on your screen are less independent than their names suggest.
The simplest link is a currency that appears in both pairs. EUR/USD, GBP/USD and AUD/USD all have the dollar as the quote currency (the second one in the pair). When the dollar weakens broadly, all three tend to rise together. When it strengthens, all three tend to fall.
| Position | You are long | You are short |
|---|---|---|
| Buy EUR/USD | Euro | US dollar |
| Buy GBP/USD | Pound | US dollar |
| Buy AUD/USD | Australian dollar | US dollar |
Pairs without a common currency can still move together. AUD/USD and NZD/USD are close partners because Australia and New Zealand are neighbors with similar export-driven economies and similar sensitivity to global risk appetite. They tend to rise and fall together even though Australian and New Zealand dollars are different currencies.
Negative correlation usually comes from the same currency sitting on opposite sides. EUR/USD has the dollar second. USD/CHF has the dollar first. A rising dollar pushes USD/CHF up and EUR/USD down, so the two have often shown a strongly negative relationship. The Swiss franc also tends to track the euro, which reinforces the link.
A forex correlation table is a grid with the same pairs down the side and across the top. Each cell shows the coefficient for that combination. The diagonal is always +1, because a pair is perfectly correlated with itself. The table mirrors itself across the diagonal, so you only need to read one half.
The table below is not a table of live numbers. Real coefficients change every week. It shows the direction and strength you have usually seen in these forex correlation pairs, and why. Always check a current table before you rely on any of it.
| Pair combination | Usual relationship | Main reason |
|---|---|---|
| EUR/USD and GBP/USD | Strongly positive | Both are priced against the dollar, and both economies are in Europe |
| AUD/USD and NZD/USD | Strongly positive | Similar economies and sensitivity to global risk appetite |
| EUR/USD and USD/CHF | Strongly negative | Dollar on opposite sides, and the franc tracks the euro |
| EUR/USD and USD/JPY | Mildly negative, unstable | Dollar on opposite sides, but the yen has its own drivers |
| USD/JPY and GBP/JPY | Positive | Both depend heavily on the yen leg |
| EUR/USD and AUD/JPY | Weak | No shared currency and different drivers |
Gold also belongs in this picture. XAU/USD is priced in dollars, so it often moves opposite to the dollar and can line up with EUR/USD or AUD/USD. The link has been unreliable in some years, so treat it as a tendency to check rather than a rule. The article on gold and the FOMC shows how the dollar and rates push the metal around.
Correlation changes
A coefficient measured over 20 days can differ sharply from one measured over 200 days. Pairs that drift apart in quiet markets often snap back together in a sell-off, when traders move out of risk all at once. Use correlation as a guide to what might happen, not a promise.
Suppose you follow the one-percent rule from the article on how to size a position. You risk $24 per trade on a $2,400 account. You like three setups: long EUR/USD, long GBP/USD and long AUD/USD, each with a 40-pip stop.
The lot size calculator gives 0.06 lots on each pair for a $24 risk. A 40-pip stop at 0.06 lots costs $24 whichever of the three it is. Each trade on its own respects the rule.
| Trade | Lots | Stop | Risk if stopped |
|---|---|---|---|
| Buy EUR/USD | 0.06 | 40 pips | $24 (1%) |
| Buy GBP/USD | 0.06 | 40 pips | $24 (1%) |
| Buy AUD/USD | 0.06 | 40 pips | $24 (1%) |
| All three | 0.18 | — | $72 (3%) |
If the dollar jumps on an unexpected data release, all three can reach their stops within minutes. You did not lose 1% three times by bad luck. You lost 3% on one idea, and you chose that size when you placed the second and third ticket.
For equal-sized trades with a similar correlation between each pair, you can estimate the combined swing with one formula. It is a guide for typical moves, not a worst case. The worst case is always the sum of the stops.
What each variable means:
With three trades at 1% each, the estimate is 1.73% if the pairs are unrelated, 2.45% at a correlation of 0.5, 2.79% at 0.8 and the full 3.00% at 1. The higher the correlation, the less diversification you really have.
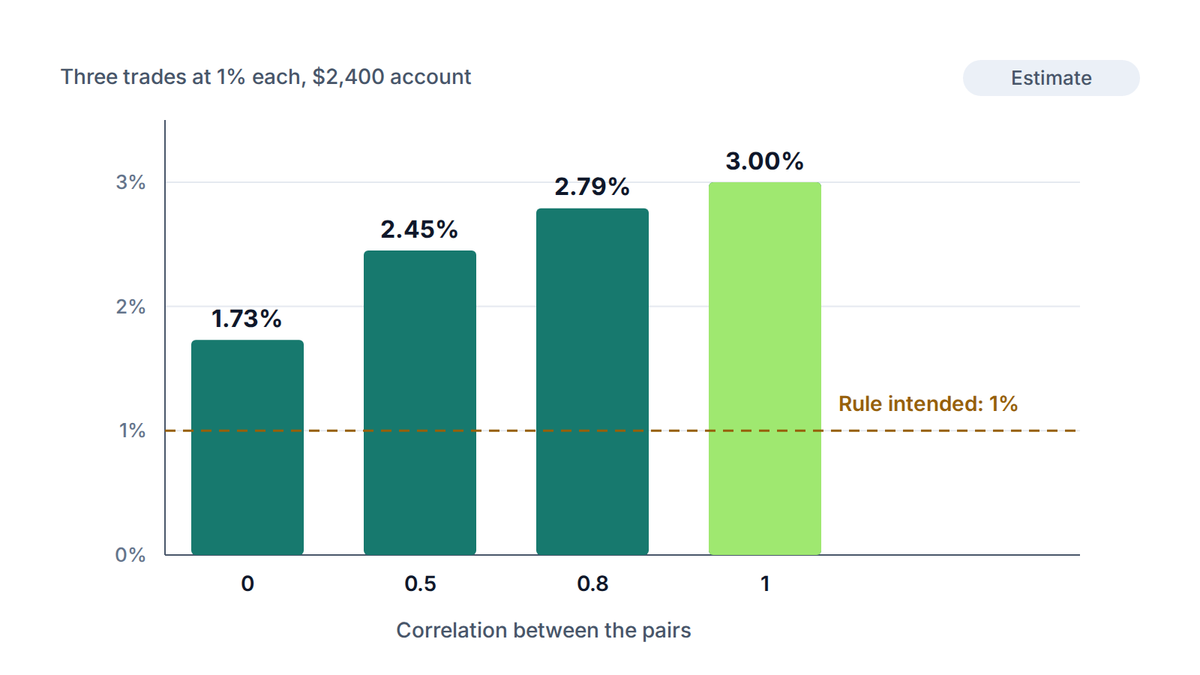
The same logic applies to drawdown, the fall from an account's peak. A cluster that moves together turns a normal losing streak into a deeper dip than you planned. The article on drawdown explains how that gap widens.
You do not have to avoid correlated pairs. You only have to count them honestly. These are the three most common approaches.
Count the legs
Before you open a position, write down the two currencies you are long and short. If the new trade repeats a long or a short leg already in your list, add its risk to that leg's total.
The same habit applies to yen trades. Long USD/JPY, long EUR/JPY and long GBP/JPY all lose when the yen jumps, as the yen carry trade article shows. The lesson on correlated exposure turns this into caps per currency and per theme.
Forex correlation is a measure of how two currency pairs move relative to each other over a set period. It runs from −1 to +1. A positive number means they tend to move in the same direction, a negative number means opposite directions, and zero means no consistent link.
EUR/USD and GBP/USD, and AUD/USD and NZD/USD, are the classic examples of pairs that often move together. Pairs that share a currency, such as USD/JPY and GBP/JPY, also tend to rise and fall in step. Check a current table, because the strength of these links changes.
It can change from month to month. Interest rate shifts, shocks and changes in risk appetite all move it. The window you pick also matters: 20 days and 200 days often give different answers for the same two pairs.
No trade is safe, but you can size correlated trades sensibly. Treat the group as one position, give it a single risk budget and keep the combined stop loss total inside the limit you set for any single idea. CFDs are leveraged products and can lose money quickly.
Only partly. Two pairs that usually move in opposite directions can offset each other, but the link is not exact and it can break. You also pay the spread on both trades, so the combination costs more than doing nothing.
The PipsMorrow Team
A team of writers covering XAU/USD gold trading education. We focus on explaining the mechanics and risk management in a structured way, with no trade signals and no promotion of any specific broker.
Last updated
The correlation between DXY and gold is usually negative but far from fixed. Learn why, how to read a DXY vs gold chart, and how to size trades around it.
9 min read
Read more →Multi timeframe analysis lets a higher chart set direction and a lower one set timing. Learn a three-step top-down routine you can use on any pair.
10 min read
Read more →FOMC and gold explained: why the rate decision is rarely the news, when it lands in New York time and UTC, and how to size a gold trade around it.
12 min read
Read more →Build on this article with the full gold trading curriculum, ordered from the basics to advanced topics, free.
